Broccoli cheese soup vs. Chicken tortilla soup — In-Depth Nutrition Comparison
Compare
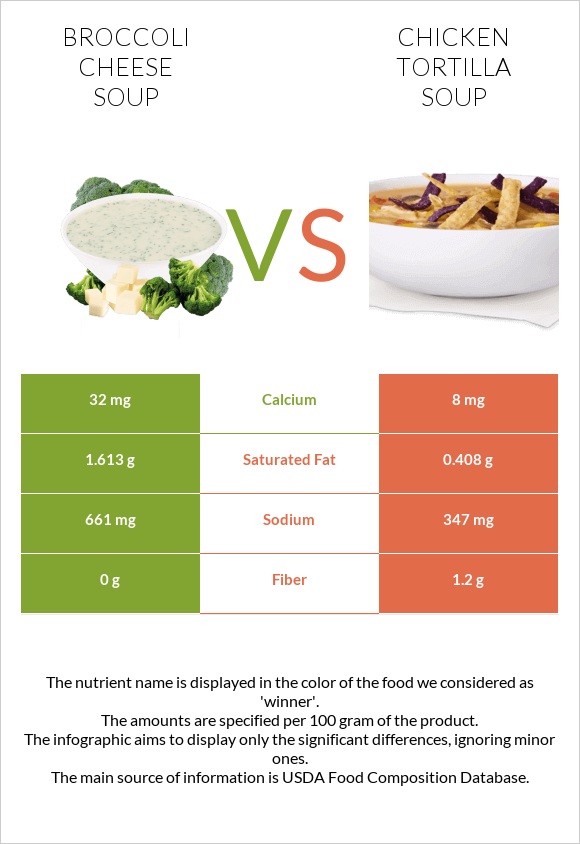
What are the differences between broccoli cheese soup and chicken tortilla soup?
- Broccoli cheese soup is richer than chicken tortilla soup in vitamin A.
- Broccoli cheese soup's daily need coverage for vitamin A is 14% more.
- Broccoli cheese soup has 4 times more calcium than chicken tortilla soup. While broccoli cheese soup has 32mg of calcium, chicken tortilla soup has only 8mg.
- The amount of saturated fat in chicken tortilla soup is lower.
We used CAMPBELL'S Red and White, Broccoli Cheese Soup, condensed and CAMPBELL'S Homestyle Mexican Style Chicken Tortilla Soup types in this article.
Infographic
Infographic link
Mineral Comparison
Mineral comparison score is based on the number of minerals by which one or the other food is richer. The "coverage" charts below show how much of the daily needs can be covered by 300 grams of the food.
| Contains more CalciumCalcium | +300% |
| Contains more PotassiumPotassium | +∞% |
| Contains more ZincZinc | +∞% |
| Contains more IronIron | +∞% |
| Contains less SodiumSodium | -47.5% |
Vitamin Comparison
Vitamin comparison score is based on the number of vitamins by which one or the other food is richer. The "coverage" charts below show how much of the daily needs can be covered by 300 grams of the food.
| Contains more Vitamin CVitamin C | +∞% |
All nutrients comparison - raw data values
| Nutrient |  |
 |
DV% diff. |
| Zinc | 8.47mg | 77% | |
| Sodium | 661mg | 347mg | 14% |
| Potassium | 234mg | 7% | |
| Fiber | 0g | 1.2g | 5% |
| Saturated fat | 1.613g | 0.408g | 5% |
| Monounsaturated fat | 2.016g | 5% | |
| Fats | 3.63g | 0.82g | 4% |
| Protein | 1.61g | 2.86g | 3% |
| Calcium | 32mg | 8mg | 2% |
| Iron | 0mg | 0.15mg | 2% |
| Calories | 81kcal | 53kcal | 1% |
| Vitamin C | 1mg | 0mg | 1% |
| Carbs | 9.68g | 8.16g | 1% |
| Protein per 100 calories | 2g | 5.4g | N/A |
| Calories per 10 g protein | 503kcal | 185kcal | N/A |
| Weight per 100 calories | 123g | 189g | N/A |
| Unsaturated / Saturated Fat ratio | 1.2 | 0 | N/A |
| Net carbs | 9.68g | 6.96g | N/A |
| Cholesterol | 4mg | 4mg | 0% |
| Sugar | 2.42g | 1.63g | N/A |
Macronutrient Comparison
Macronutrient breakdown side-by-side comparison
Protein:
1.61 g
Fats:
3.63 g
Carbs:
9.68 g
Water:
83.1 g
Other:
1.98 g
Protein:
2.86 g
Fats:
0.82 g
Carbs:
8.16 g
Water:
86.4 g
Other:
1.76 g
| Contains more FatsFats | +342.7% |
| Contains more CarbsCarbs | +18.6% |
| Contains more OtherOther | +12.5% |
| Contains more ProteinProtein | +77.6% |
~equal in
Water
~86.4g
Fat Type Comparison
Fat type breakdown side-by-side comparison
Saturated fat:
Sat. Fat
1.613 g
Monounsaturated fat:
Mono. Fat
2.016 g
Polyunsaturated fat:
Poly. Fat
0 g
Saturated fat:
Sat. Fat
0.408 g
Monounsaturated fat:
Mono. Fat
0 g
Polyunsaturated fat:
Poly. Fat
0 g
| Contains more Mono. FatMonounsaturated fat | +∞% |
| Contains less Sat. FatSaturated fat | -74.7% |
~equal in
Polyunsaturated fat
~g


