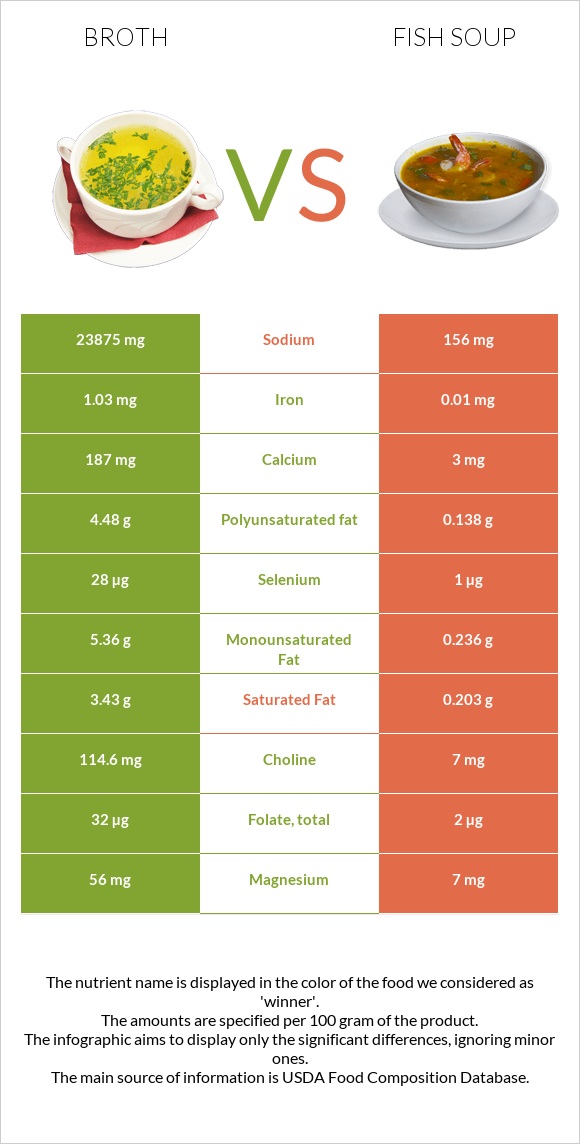
The main differences between broth and fish soup Broth has more selenium, vitamin B2, choline, calcium, phosphorus, iron, and magnesium; however, fish soup has more vitamin B12. Daily need coverage for sodium for broth is 1031% higher. Fish soup has 103 times less iron than broth. Broth has 1.03mg of iron, while fish soup has 0.01mg. Fish soup is lower in sodium. Food types used in this article are Soup, chicken broth or bouillon, dry and Soup, stock, fish, home-prepared .
Infographic
Mineral Comparison
Mineral comparison score is based on the number of minerals by which one or the other food is richer. The "coverage" charts below show how much of the daily needs can be covered by 300 grams of the food.
8
100 g
300 g
1 teaspoon - 2g 1 cube - 4g
Magnesium
Magnesium
Calcium
Calcium
Potassium
Potassium
Iron
Iron
Copper
Copper
Zinc
Zinc
Phosphorus
Phosphorus
Sodium
Sodium
Manganese
Manganese
Selenium
Selenium
40%
56%
27%
39%
0%
2.5%
71%
3114%
20%
153%
2
100 g
300 g
1 cup - 233g
Magnesium
Magnesium
Calcium
Calcium
Potassium
Potassium
Iron
Iron
Copper
Copper
Zinc
Zinc
Phosphorus
Phosphorus
Sodium
Sodium
Manganese
Manganese
Selenium
Selenium
5%
0.9%
13%
0.38%
19%
1.6%
24%
20%
6.8%
5.5%
Vitamin Comparison
Vitamin comparison score is based on the number of vitamins by which one or the other food is richer. The "coverage" charts below show how much of the daily needs can be covered by 300 grams of the food.
8
100 g
300 g
1 teaspoon - 2g 1 cube - 4g
Vitamin C
Vit. C
Vitamin D
Vit. D
Vitamin A
Vit. A
Vitamin E
Vit. E
Vitamin B1
Vit. B1
Vitamin B2
Vit. B2
Vitamin B3
Vit. B3
Vitamin B5
Vit. B5
Vitamin B6
Vit. B6
Vitamin B12
Vit. B12
Vitamin K
Vit. K
Folate
Folate
3.7%
0%
0%
9.2%
25%
99%
46%
36%
23%
38%
0%
24%
2
100 g
300 g
1 cup - 233g
Vitamin C
Vit. C
Vitamin D
Vit. D
Vitamin A
Vit. A
Vitamin E
Vit. E
Vitamin B1
Vit. B1
Vitamin B2
Vit. B2
Vitamin B3
Vit. B3
Vitamin B5
Vit. B5
Vitamin B6
Vit. B6
Vitamin B12
Vit. B12
Vitamin K
Vit. K
Folate
Folate
0.33%
0%
0.67%
3.4%
8.3%
18%
22%
20%
8.5%
86%
0%
1.5%
All nutrients comparison - raw data values
Nutrient
DV% diff.
Sodium
23875mg
156mg
1031%
Selenium
28µg
1µg
49%
Protein
16.66g
2.26g
29%
Polyunsaturated fat
4.48g
0.138g
29%
Vitamin B2
0.43mg
0.076mg
27%
Fats
13.88g
0.81g
20%
Choline
114.6mg
7mg
20%
Calcium
187mg
3mg
18%
Phosphorus
166mg
56mg
16%
Vitamin B12
0.3µg
0.69µg
16%
Saturated fat
3.43g
0.203g
15%
Calories
267kcal
16kcal
13%
Iron
1.03mg
0.01mg
13%
Monounsaturated fat
5.36g
0.236g
13%
Magnesium
56mg
7mg
12%
Vitamin B3
2.46mg
1.186mg
8%
Folate
32µg
2µg
8%
Carbs
18.01g
0g
6%
Copper
0mg
0.058mg
6%
Vitamin B1
0.1mg
0.033mg
6%
Potassium
309mg
144mg
5%
Vitamin B5
0.6mg
0.329mg
5%
Vitamin B6
0.1mg
0.037mg
5%
Cholesterol
13mg
1mg
4%
Manganese
0.15mg
0.052mg
4%
Vitamin E
0.46mg
0.17mg
2%
Vitamin C
1.1mg
0.1mg
1%
Protein per 100 calories
6.2g
14g
N/A
Calories per 10 g protein
160kcal
71kcal
N/A
Weight per 100 calories
37g
625g
N/A
Unsaturated / Saturated Fat ratio
2.9
1.8
N/A
Net carbs
18.01g
0g
N/A
Sugar
17.36g
0g
N/A
Zinc
0.09mg
0.06mg
0%
Vitamin A
0µg
2µg
0%
Omega-3 - EPA
0g
0.035g
N/A
Omega-3 - DHA
0g
0.049g
N/A
Omega-3 - DPA
0g
0.017g
N/A
Macronutrient Comparison
Macronutrient breakdown side-by-side comparison
4
17%
14%
18%
2%
49%
Protein:
16.66 g
Fats:
13.88 g
Carbs:
18.01 g
Water:
2.27 g
Other:
49.18 g
1
2%
97%
Protein:
2.26 g
Fats:
0.81 g
Carbs:
0 g
Water:
96.6 g
Other:
0.33 g
Contains
more
Protein Protein
+637.2%
Contains
more
Fats Fats
+1613.6%
Contains
more
Carbs Carbs
+∞%
Contains
more
Other Other
+14803%
Contains
more
Water Water
+4155.5%
Fat Type Comparison
Fat type breakdown side-by-side comparison
2
26%
40%
34%
Saturated fat:
Sat. Fat
3.43 g
Monounsaturated fat:
Mono. Fat
5.36 g
Polyunsaturated fat:
Poly. Fat
4.48 g
1
35%
41%
24%
Saturated fat:
Sat. Fat
0.203 g
Monounsaturated fat:
Mono. Fat
0.236 g
Polyunsaturated fat:
Poly. Fat
0.138 g
Contains
more
Mono. Fat Monounsaturated fat
+2171.2%
Contains
more
Poly. Fat Polyunsaturated fat
+3146.4%
Contains
less
Sat. Fat Saturated fat
-94.1%