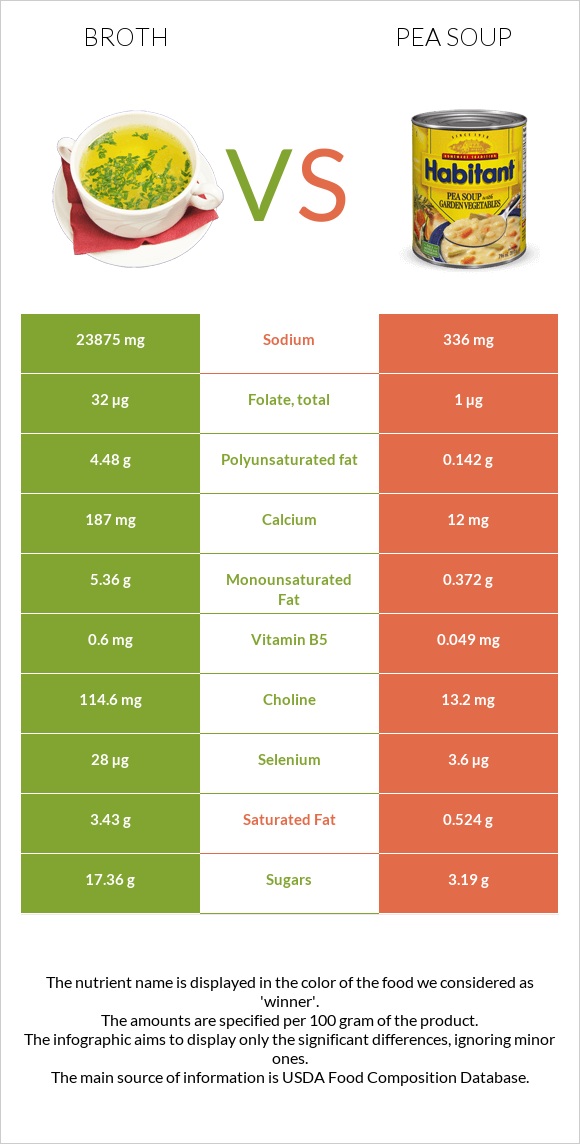
How are broth and pea soup different? Broth is higher in selenium, vitamin B2, choline, calcium, phosphorus, vitamin B12, and vitamin B3; however, pea soup is richer in copper. Daily need coverage for sodium for broth is 1023% higher. Pea soup has less sodium. Broth has a lower glycemic index (45) than pea soup (66). Soup, chicken broth or bouillon, dry and Soup, pea, green, canned, prepared with equal volume water are the varieties used in this article.
Infographic
Mineral Comparison
Mineral comparison score is based on the number of minerals by which one or the other food is richer. The "coverage" charts below show how much of the daily needs can be covered by 300 grams of the food.
6
100 g
300 g
1 teaspoon - 2g 1 cube - 4g
Magnesium
Magnesium
Calcium
Calcium
Potassium
Potassium
Iron
Iron
Copper
Copper
Zinc
Zinc
Phosphorus
Phosphorus
Sodium
Sodium
Manganese
Manganese
Selenium
Selenium
40%
56%
27%
39%
0%
2.5%
71%
3114%
20%
153%
4
100 g
300 g
1 fl oz - 32.4g 1 serving 1 cup - 259g
Magnesium
Magnesium
Calcium
Calcium
Potassium
Potassium
Iron
Iron
Copper
Copper
Zinc
Zinc
Phosphorus
Phosphorus
Sodium
Sodium
Manganese
Manganese
Selenium
Selenium
11%
3.6%
6.3%
27%
49%
17%
20%
44%
32%
20%
Vitamin Comparison
Vitamin comparison score is based on the number of vitamins by which one or the other food is richer. The "coverage" charts below show how much of the daily needs can be covered by 300 grams of the food.
9
100 g
300 g
1 teaspoon - 2g 1 cube - 4g
Vitamin C
Vit. C
Vitamin D
Vit. D
Vitamin A
Vit. A
Vitamin E
Vit. E
Vitamin B1
Vit. B1
Vitamin B2
Vit. B2
Vitamin B3
Vit. B3
Vitamin B5
Vit. B5
Vitamin B6
Vit. B6
Vitamin B12
Vit. B12
Vitamin K
Vit. K
Folate
Folate
3.7%
0%
0%
9.2%
25%
99%
46%
36%
23%
38%
0%
24%
2
100 g
300 g
1 fl oz - 32.4g 1 serving 1 cup - 259g
Vitamin C
Vit. C
Vitamin D
Vit. D
Vitamin A
Vit. A
Vitamin E
Vit. E
Vitamin B1
Vit. B1
Vitamin B2
Vit. B2
Vitamin B3
Vit. B3
Vitamin B5
Vit. B5
Vitamin B6
Vit. B6
Vitamin B12
Vit. B12
Vitamin K
Vit. K
Folate
Folate
2%
0%
1%
1.8%
10%
5.8%
8.7%
2.9%
4.6%
0%
0.5%
0.75%
All nutrients comparison - raw data values
Nutrient
DV% diff.
Sodium
23875mg
336mg
1023%
Selenium
28µg
3.6µg
44%
Vitamin B2
0.43mg
0.025mg
31%
Polyunsaturated fat
4.48g
0.142g
29%
Protein
16.66g
3.2g
27%
Fats
13.88g
1.09g
20%
Calcium
187mg
12mg
18%
Choline
114.6mg
13.2mg
18%
Phosphorus
166mg
47mg
17%
Copper
0mg
0.146mg
16%
Vitamin B12
0.3µg
0µg
13%
Saturated fat
3.43g
0.524g
13%
Vitamin B3
2.46mg
0.462mg
12%
Monounsaturated fat
5.36g
0.372g
12%
Vitamin B5
0.6mg
0.049mg
11%
Calories
267kcal
61kcal
10%
Magnesium
56mg
15mg
10%
Fiber
0g
1.9g
8%
Folate
32µg
1µg
8%
Potassium
309mg
71mg
7%
Vitamin B6
0.1mg
0.02mg
6%
Zinc
0.09mg
0.64mg
5%
Vitamin B1
0.1mg
0.04mg
5%
Cholesterol
13mg
0mg
4%
Iron
1.03mg
0.73mg
4%
Manganese
0.15mg
0.245mg
4%
Carbs
18.01g
9.88g
3%
Vitamin E
0.46mg
0.09mg
2%
Vitamin C
1.1mg
0.6mg
1%
Protein per 100 calories
6.2g
5.2g
N/A
Calories per 10 g protein
160kcal
191kcal
N/A
Weight per 100 calories
37g
164g
N/A
Unsaturated / Saturated Fat ratio
2.9
0.98
N/A
Net carbs
18.01g
7.98g
N/A
Sugar
17.36g
3.19g
N/A
Vitamin A
0µg
3µg
0%
Vitamin K
0µg
0.2µg
0%
Macronutrient Comparison
Macronutrient breakdown side-by-side comparison
4
17%
14%
18%
2%
49%
Protein:
16.66 g
Fats:
13.88 g
Carbs:
18.01 g
Water:
2.27 g
Other:
49.18 g
1
3%
10%
85%
Protein:
3.2 g
Fats:
1.09 g
Carbs:
9.88 g
Water:
84.55 g
Other:
1.28 g
Contains
more
Protein Protein
+420.6%
Contains
more
Fats Fats
+1173.4%
Contains
more
Carbs Carbs
+82.3%
Contains
more
Other Other
+3742.2%
Contains
more
Water Water
+3624.7%
Fat Type Comparison
Fat type breakdown side-by-side comparison
2
26%
40%
34%
Saturated fat:
Sat. Fat
3.43 g
Monounsaturated fat:
Mono. Fat
5.36 g
Polyunsaturated fat:
Poly. Fat
4.48 g
1
50%
36%
14%
Saturated fat:
Sat. Fat
0.524 g
Monounsaturated fat:
Mono. Fat
0.372 g
Polyunsaturated fat:
Poly. Fat
0.142 g
Contains
more
Mono. Fat Monounsaturated fat
+1340.9%
Contains
more
Poly. Fat Polyunsaturated fat
+3054.9%
Contains
less
Sat. Fat Saturated fat
-84.7%