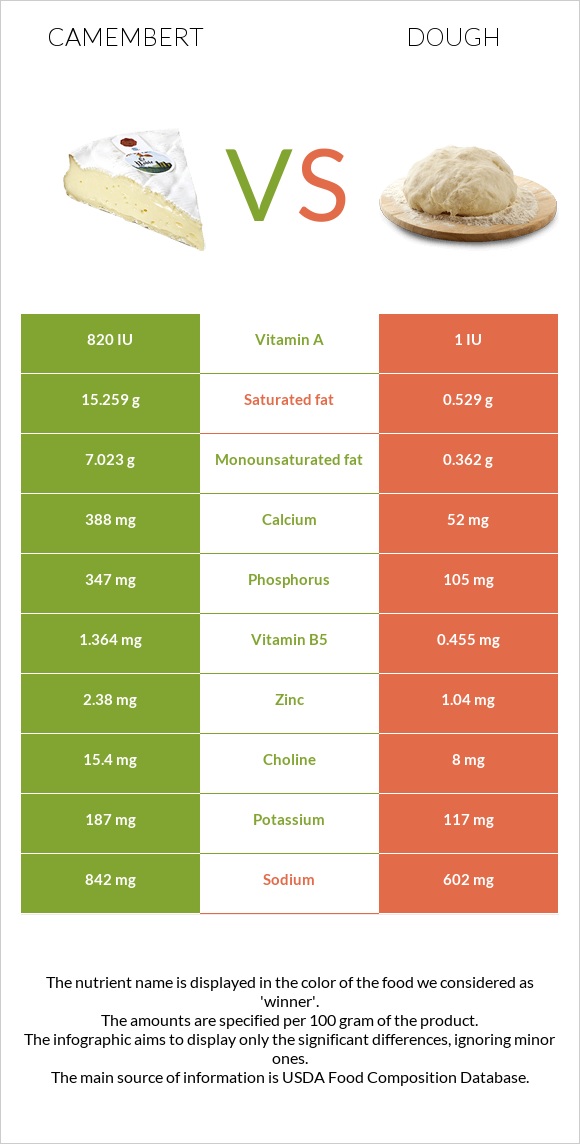
What are the main differences between camembert and dough? Camembert is richer in vitamin B12, phosphorus, and calcium, while dough is higher in vitamin B1, iron, vitamin B3, selenium, and manganese. Camembert's daily need coverage for saturated fat is 74% higher. Dough is lower in cholesterol. Dough has a higher glycemic index (70) than camembert (27). We used Cheese, camembert and Bread, french or vienna (includes sourdough) types in this comparison.
Infographic
Mineral Comparison
Mineral comparison score is based on the number of minerals by which one or the other food is richer. The "coverage" charts below show how much of the daily needs can be covered by 300 grams of the food.
4
100 g
300 g
1 cubic inch - 17g 1 oz - 28.35g 1 wedge (1.33 oz) - 38g 1 cup - 246g
Magnesium
Magnesium
Calcium
Calcium
Potassium
Potassium
Iron
Iron
Copper
Copper
Zinc
Zinc
Phosphorus
Phosphorus
Sodium
Sodium
Manganese
Manganese
Selenium
Selenium
14%
116%
17%
12%
7%
65%
149%
110%
5%
79%
6
100 g
300 g
1 oz - 28.35g 1 slice - 139g
Magnesium
Magnesium
Calcium
Calcium
Potassium
Potassium
Iron
Iron
Copper
Copper
Zinc
Zinc
Phosphorus
Phosphorus
Sodium
Sodium
Manganese
Manganese
Selenium
Selenium
23%
16%
10%
147%
51%
28%
45%
79%
75%
156%
Vitamin Comparison
Vitamin comparison score is based on the number of vitamins by which one or the other food is richer. The "coverage" charts below show how much of the daily needs can be covered by 300 grams of the food.
7
100 g
300 g
1 cubic inch - 17g 1 oz - 28.35g 1 wedge (1.33 oz) - 38g 1 cup - 246g
Vitamin C
Vit. C
Vitamin D
Vit. D
Vitamin A
Vit. A
Vitamin E
Vit. E
Vitamin B1
Vit. B1
Vitamin B2
Vit. B2
Vitamin B3
Vit. B3
Vitamin B5
Vit. B5
Vitamin B6
Vit. B6
Vitamin B12
Vit. B12
Vitamin K
Vit. K
Folate
Folate
0%
6%
80%
4.2%
7%
113%
12%
82%
52%
163%
5%
47%
3
100 g
300 g
1 oz - 28.35g 1 slice - 139g
Vitamin C
Vit. C
Vitamin D
Vit. D
Vitamin A
Vit. A
Vitamin E
Vit. E
Vitamin B1
Vit. B1
Vitamin B2
Vit. B2
Vitamin B3
Vit. B3
Vitamin B5
Vit. B5
Vitamin B6
Vit. B6
Vitamin B12
Vit. B12
Vitamin K
Vit. K
Folate
Folate
0%
0%
0%
4.2%
178%
99%
90%
27%
25%
0%
1.8%
92%
All nutrients comparison - raw data values
Nutrient
DV% diff.
Saturated fat
15.259g
0.529g
67%
Vitamin B1
0.028mg
0.71mg
57%
Vitamin B12
1.3µg
0µg
54%
Iron
0.33mg
3.91mg
45%
Phosphorus
347mg
105mg
35%
Fats
24.26g
2.42g
34%
Calcium
388mg
52mg
34%
Vitamin A
241µg
0µg
27%
Selenium
14.5µg
28.6µg
26%
Vitamin B3
0.63mg
4.817mg
26%
Cholesterol
72mg
0mg
24%
Manganese
0.038mg
0.577mg
23%
Protein
19.8g
10.75g
18%
Starch
44.23g
18%
Vitamin B5
1.364mg
0.455mg
18%
Carbs
0.46g
51.88g
17%
Monounsaturated fat
7.023g
0.362g
17%
Copper
0.021mg
0.152mg
15%
Folate
62µg
123µg
15%
Zinc
2.38mg
1.04mg
12%
Sodium
842mg
602mg
10%
Fiber
0g
2.2g
9%
Vitamin B6
0.227mg
0.107mg
9%
Vitamin B2
0.488mg
0.427mg
5%
Magnesium
20mg
32mg
3%
Vitamin D*
18 IU
0 IU
2%
Vitamin D
0.4µg
0µg
2%
Potassium
187mg
117mg
2%
Calories
300kcal
272kcal
1%
Vitamin K
2µg
0.7µg
1%
Choline
15.4mg
8mg
1%
Polyunsaturated fat
0.724g
0.855g
1%
Fructose
0.51g
1%
Protein per 100 calories
6.6g
4g
N/A
Calories per 10 g protein
152kcal
253kcal
N/A
Weight per 100 calories
33g
37g
N/A
Unsaturated / Saturated Fat ratio
0.51
2.3
N/A
Net carbs
0.46g
49.68g
N/A
Sugar
0.46g
4.62g
N/A
Vitamin E
0.21mg
0.21mg
0%
Trans fat
0.005g
N/A
Tryptophan
0.307mg
0%
Threonine
0.717mg
0%
Isoleucine
0.968mg
0%
Leucine
1.84mg
0%
Lysine
1.766mg
0%
Methionine
0.565mg
0%
Phenylalanine
1.105mg
0%
Valine
1.279mg
0%
Histidine
0.683mg
0%
Omega-3 - ALA
0.063g
N/A
Omega-6 - Gamma-linoleic acid
0.001g
N/A
Omega-6 - Linoleic acid
0.788g
N/A
Macronutrient Comparison
Macronutrient breakdown side-by-side comparison
4
20%
24%
52%
4%
Protein:
19.8 g
Fats:
24.26 g
Carbs:
0.46 g
Water:
51.8 g
Other:
3.68 g
1
11%
2%
52%
33%
2%
Protein:
10.75 g
Fats:
2.42 g
Carbs:
51.88 g
Water:
33 g
Other:
1.95 g
Contains
more
Protein Protein
+84.2%
Contains
more
Fats Fats
+902.5%
Contains
more
Water Water
+57%
Contains
more
Other Other
+88.7%
Contains
more
Carbs Carbs
+11178.3%
Fat Type Comparison
Fat type breakdown side-by-side comparison
1
66%
31%
3%
Saturated fat:
Sat. Fat
15.259 g
Monounsaturated fat:
Mono. Fat
7.023 g
Polyunsaturated fat:
Poly. Fat
0.724 g
2
30%
21%
49%
Saturated fat:
Sat. Fat
0.529 g
Monounsaturated fat:
Mono. Fat
0.362 g
Polyunsaturated fat:
Poly. Fat
0.855 g
Contains
more
Mono. Fat Monounsaturated fat
+1840.1%
Contains
less
Sat. Fat Saturated fat
-96.5%
Contains
more
Poly. Fat Polyunsaturated fat
+18.1%