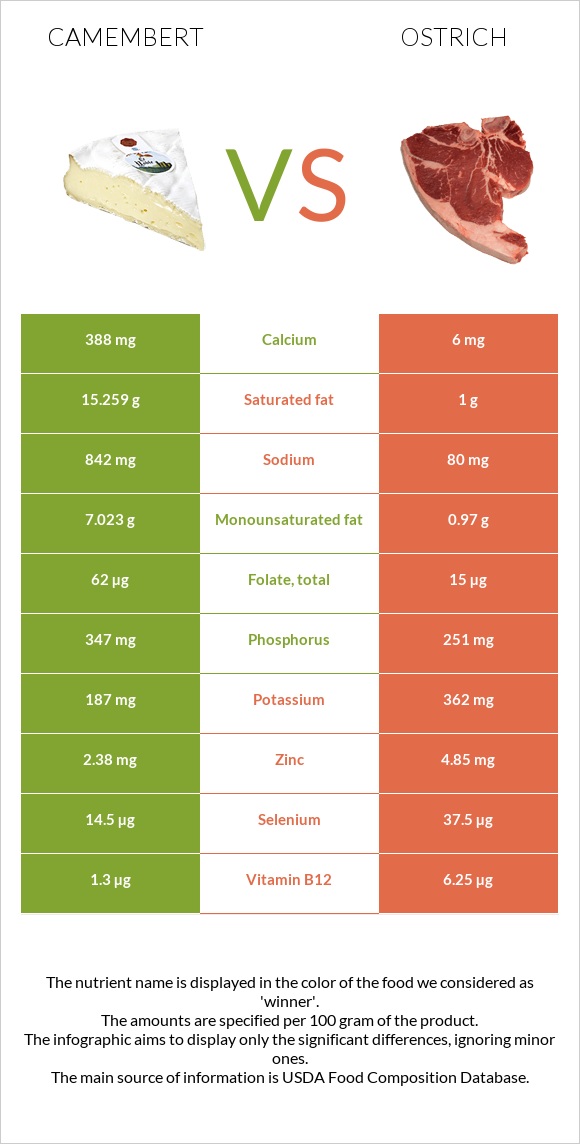
Summary of differences between camembert and ostrich Camembert has more calcium; however, ostrich is higher in vitamin B12, selenium, vitamin B3, iron, vitamin B6, zinc, and vitamin B1. Ostrich covers your daily need for vitamin B12, 206% more than camembert. Camembert has 65 times more calcium than ostrich. While camembert has 388mg of calcium, ostrich has only 6mg. Ostrich has less saturated fat. The glycemic index of camembert is higher. These are the specific foods used in this comparison Cheese, camembert and Ostrich, tip trimmed, cooked .
Infographic
Mineral Comparison
Mineral comparison score is based on the number of minerals by which one or the other food is richer. The "coverage" charts below show how much of the daily needs can be covered by 300 grams of the food.
3
100 g
300 g
1 cubic inch - 17g 1 oz - 28.35g 1 wedge (1.33 oz) - 38g 1 cup - 246g
Magnesium
Magnesium
Calcium
Calcium
Potassium
Potassium
Iron
Iron
Copper
Copper
Zinc
Zinc
Phosphorus
Phosphorus
Sodium
Sodium
Manganese
Manganese
Selenium
Selenium
14%
116%
17%
12%
7%
65%
149%
110%
5%
79%
7
100 g
300 g
1 serving ( 3 oz ) - 85g
Magnesium
Magnesium
Calcium
Calcium
Potassium
Potassium
Iron
Iron
Copper
Copper
Zinc
Zinc
Phosphorus
Phosphorus
Sodium
Sodium
Manganese
Manganese
Selenium
Selenium
18%
1.8%
32%
105%
51%
132%
108%
10%
2.5%
205%
Vitamin Comparison
Vitamin comparison score is based on the number of vitamins by which one or the other food is richer. The "coverage" charts below show how much of the daily needs can be covered by 300 grams of the food.
5
100 g
300 g
1 cubic inch - 17g 1 oz - 28.35g 1 wedge (1.33 oz) - 38g 1 cup - 246g
Vitamin C
Vit. C
Vitamin D
Vit. D
Vitamin A
Vit. A
Vitamin E
Vit. E
Vitamin B1
Vit. B1
Vitamin B2
Vit. B2
Vitamin B3
Vit. B3
Vitamin B5
Vit. B5
Vitamin B6
Vit. B6
Vitamin B12
Vit. B12
Vitamin K
Vit. K
Folate
Folate
0%
6%
80%
4.2%
7%
113%
12%
82%
52%
163%
5%
47%
4
100 g
300 g
1 serving ( 3 oz ) - 85g
Vitamin C
Vit. C
Vitamin D
Vit. D
Vitamin A
Vit. A
Vitamin E
Vit. E
Vitamin B1
Vit. B1
Vitamin B2
Vit. B2
Vitamin B3
Vit. B3
Vitamin B5
Vit. B5
Vitamin B6
Vit. B6
Vitamin B12
Vit. B12
Vitamin K
Vit. K
Folate
Folate
0%
0%
0%
4.6%
58%
67%
134%
79%
126%
781%
0%
11%
All nutrients comparison - raw data values
Nutrient
DV% diff.
Vitamin B12
1.3µg
6.25µg
206%
Saturated fat
15.259g
1g
65%
Selenium
14.5µg
37.5µg
42%
Vitamin B3
0.63mg
7.143mg
41%
Calcium
388mg
6mg
38%
Fats
24.26g
2.57g
33%
Sodium
842mg
80mg
33%
Iron
0.33mg
2.79mg
31%
Vitamin A
241µg
0µg
27%
Vitamin B6
0.227mg
0.545mg
24%
Zinc
2.38mg
4.85mg
22%
Protein
19.8g
28.49g
17%
Vitamin B1
0.028mg
0.232mg
17%
Copper
0.021mg
0.152mg
15%
Vitamin B2
0.488mg
0.292mg
15%
Monounsaturated fat
7.023g
0.97g
15%
Phosphorus
347mg
251mg
14%
Folate
62µg
15µg
12%
Calories
300kcal
145kcal
8%
Potassium
187mg
362mg
5%
Cholesterol
72mg
85mg
4%
Choline
15.4mg
3%
Vitamin D*
18 IU
2%
Vitamin D
0.4µg
2%
Vitamin K
2µg
2%
Polyunsaturated fat
0.724g
0.44g
2%
Magnesium
20mg
25mg
1%
Manganese
0.038mg
0.019mg
1%
Vitamin B5
1.364mg
1.318mg
1%
Protein per 100 calories
6.6g
20g
N/A
Calories per 10 g protein
152kcal
51kcal
N/A
Weight per 100 calories
33g
69g
N/A
Unsaturated / Saturated Fat ratio
0.51
1.4
N/A
Net carbs
0.46g
0g
N/A
Carbs
0.46g
0g
0%
Sugar
0.46g
0g
N/A
Vitamin E
0.21mg
0.23mg
0%
Tryptophan
0.307mg
0.254mg
0%
Threonine
0.717mg
1.25mg
0%
Isoleucine
0.968mg
1.354mg
0%
Leucine
1.84mg
2.315mg
0%
Lysine
1.766mg
2.516mg
0%
Methionine
0.565mg
0.796mg
0%
Phenylalanine
1.105mg
1.176mg
0%
Valine
1.279mg
1.407mg
0%
Histidine
0.683mg
0.716mg
0%
Macronutrient Comparison
Macronutrient breakdown side-by-side comparison
3
20%
24%
52%
4%
Protein:
19.8 g
Fats:
24.26 g
Carbs:
0.46 g
Water:
51.8 g
Other:
3.68 g
2
28%
3%
69%
Protein:
28.49 g
Fats:
2.57 g
Carbs:
0 g
Water:
68.51 g
Other:
0.43 g
Contains
more
Fats Fats
+844%
Contains
more
Carbs Carbs
+∞%
Contains
more
Other Other
+755.8%
Contains
more
Protein Protein
+43.9%
Contains
more
Water Water
+32.3%
Fat Type Comparison
Fat type breakdown side-by-side comparison
2
66%
31%
3%
Saturated fat:
Sat. Fat
15.259 g
Monounsaturated fat:
Mono. Fat
7.023 g
Polyunsaturated fat:
Poly. Fat
0.724 g
1
41%
40%
18%
Saturated fat:
Sat. Fat
1 g
Monounsaturated fat:
Mono. Fat
0.97 g
Polyunsaturated fat:
Poly. Fat
0.44 g
Contains
more
Mono. Fat Monounsaturated fat
+624%
Contains
more
Poly. Fat Polyunsaturated fat
+64.5%
Contains
less
Sat. Fat Saturated fat
-93.4%