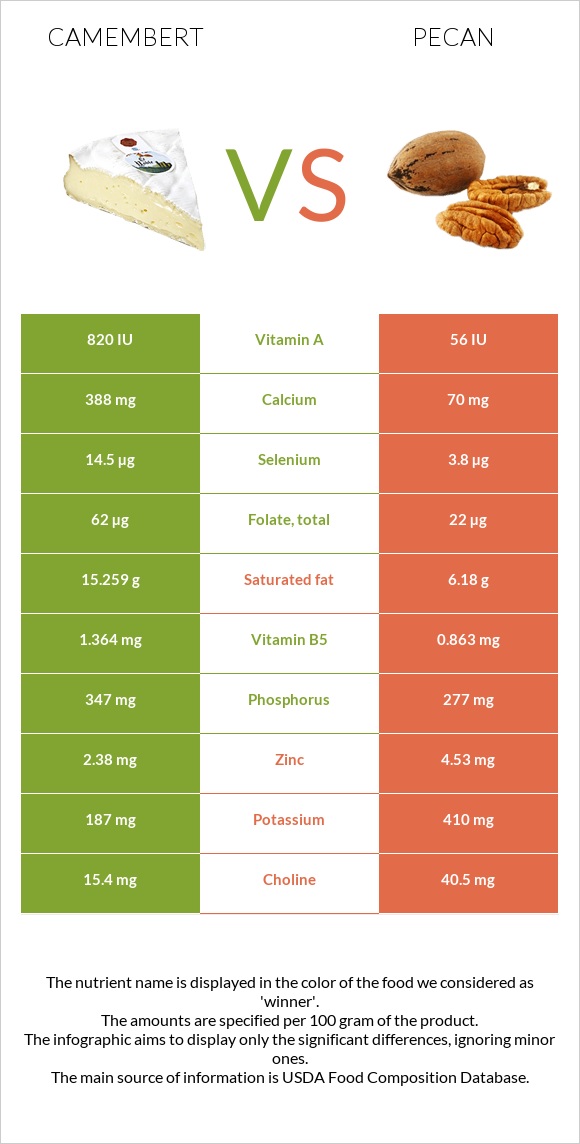
How are camembert and pecan different? Camembert is higher in vitamin B12, calcium, and vitamin B2; however, pecan is richer in manganese, copper, vitamin B1, fiber, and iron. Daily need coverage for manganese for pecan is 194% higher. Pecan has less sodium. Pecan has a lower glycemic index (10) than camembert (27). Cheese, camembert and Nuts, pecans are the varieties used in this article.
Infographic
Mineral Comparison
Mineral comparison score is based on the number of minerals by which one or the other food is richer. The "coverage" charts below show how much of the daily needs can be covered by 300 grams of the food.
3
100 g
300 g
1 cubic inch - 17g 1 oz - 28.35g 1 wedge (1.33 oz) - 38g 1 cup - 246g
Magnesium
Magnesium
Calcium
Calcium
Potassium
Potassium
Iron
Iron
Copper
Copper
Zinc
Zinc
Phosphorus
Phosphorus
Sodium
Sodium
Manganese
Manganese
Selenium
Selenium
14%
116%
17%
12%
7%
65%
149%
110%
5%
79%
7
100 g
300 g
1 oz (19 halves) - 28.35g 1 cup, halves - 99g 1 cup, chopped - 109g
Magnesium
Magnesium
Calcium
Calcium
Potassium
Potassium
Iron
Iron
Copper
Copper
Zinc
Zinc
Phosphorus
Phosphorus
Sodium
Sodium
Manganese
Manganese
Selenium
Selenium
86%
21%
36%
95%
400%
124%
119%
0%
587%
21%
Vitamin Comparison
Vitamin comparison score is based on the number of vitamins by which one or the other food is richer. The "coverage" charts below show how much of the daily needs can be covered by 300 grams of the food.
6
100 g
300 g
1 cubic inch - 17g 1 oz - 28.35g 1 wedge (1.33 oz) - 38g 1 cup - 246g
Vitamin C
Vit. C
Vitamin D
Vit. D
Vitamin A
Vit. A
Vitamin E
Vit. E
Vitamin B1
Vit. B1
Vitamin B2
Vit. B2
Vitamin B3
Vit. B3
Vitamin B5
Vit. B5
Vitamin B6
Vit. B6
Vitamin B12
Vit. B12
Vitamin K
Vit. K
Folate
Folate
0%
6%
80%
4.2%
7%
113%
12%
82%
52%
163%
5%
47%
5
100 g
300 g
1 oz (19 halves) - 28.35g 1 cup, halves - 99g 1 cup, chopped - 109g
Vitamin C
Vit. C
Vitamin D
Vit. D
Vitamin A
Vit. A
Vitamin E
Vit. E
Vitamin B1
Vit. B1
Vitamin B2
Vit. B2
Vitamin B3
Vit. B3
Vitamin B5
Vit. B5
Vitamin B6
Vit. B6
Vitamin B12
Vit. B12
Vitamin K
Vit. K
Folate
Folate
3.7%
0%
1%
28%
165%
30%
22%
52%
48%
0%
8.8%
17%
All nutrients comparison - raw data values
Nutrient
DV% diff.
Manganese
0.038mg
4.5mg
194%
Polyunsaturated fat
0.724g
21.614g
139%
Copper
0.021mg
1.2mg
131%
Monounsaturated fat
7.023g
40.801g
84%
Fats
24.26g
71.97g
73%
Vitamin B12
1.3µg
0µg
54%
Vitamin B1
0.028mg
0.66mg
53%
Saturated fat
15.259g
6.18g
41%
Fiber
0g
9.6g
38%
Sodium
842mg
0mg
37%
Calcium
388mg
70mg
32%
Iron
0.33mg
2.53mg
28%
Vitamin B2
0.488mg
0.13mg
28%
Vitamin A
241µg
3µg
26%
Cholesterol
72mg
0mg
24%
Magnesium
20mg
121mg
24%
Protein
19.8g
9.17g
21%
Calories
300kcal
691kcal
20%
Zinc
2.38mg
4.53mg
20%
Selenium
14.5µg
3.8µg
19%
Phosphorus
347mg
277mg
10%
Vitamin B5
1.364mg
0.863mg
10%
Folate
62µg
22µg
10%
Vitamin E
0.21mg
1.4mg
8%
Potassium
187mg
410mg
7%
Choline
15.4mg
40.5mg
5%
Carbs
0.46g
13.86g
4%
Vitamin B3
0.63mg
1.167mg
3%
Vitamin D*
18 IU
0 IU
2%
Vitamin D
0.4µg
0µg
2%
Vitamin C
0mg
1.1mg
1%
Vitamin B6
0.227mg
0.21mg
1%
Vitamin K
2µg
3.5µg
1%
Protein per 100 calories
6.6g
1.3g
N/A
Calories per 10 g protein
152kcal
754kcal
N/A
Weight per 100 calories
33g
14g
N/A
Unsaturated / Saturated Fat ratio
0.51
10
N/A
Net carbs
0.46g
4.26g
N/A
Sugar
0.46g
3.97g
N/A
Starch
0.46g
0%
Tryptophan
0.307mg
0.093mg
0%
Threonine
0.717mg
0.306mg
0%
Isoleucine
0.968mg
0.336mg
0%
Leucine
1.84mg
0.598mg
0%
Lysine
1.766mg
0.287mg
0%
Methionine
0.565mg
0.183mg
0%
Phenylalanine
1.105mg
0.426mg
0%
Valine
1.279mg
0.411mg
0%
Histidine
0.683mg
0.262mg
0%
Fructose
0.04g
0%
Macronutrient Comparison
Macronutrient breakdown side-by-side comparison
3
20%
24%
52%
4%
Protein:
19.8 g
Fats:
24.26 g
Carbs:
0.46 g
Water:
51.8 g
Other:
3.68 g
2
9%
72%
14%
4%
Protein:
9.17 g
Fats:
71.97 g
Carbs:
13.86 g
Water:
3.52 g
Other:
1.48 g
Contains
more
Protein Protein
+115.9%
Contains
more
Water Water
+1371.6%
Contains
more
Other Other
+148.6%
Contains
more
Fats Fats
+196.7%
Contains
more
Carbs Carbs
+2913%
Fat Type Comparison
Fat type breakdown side-by-side comparison
0
66%
31%
3%
Saturated fat:
Sat. Fat
15.259 g
Monounsaturated fat:
Mono. Fat
7.023 g
Polyunsaturated fat:
Poly. Fat
0.724 g
3
9%
59%
32%
Saturated fat:
Sat. Fat
6.18 g
Monounsaturated fat:
Mono. Fat
40.801 g
Polyunsaturated fat:
Poly. Fat
21.614 g
Contains
less
Sat. Fat Saturated fat
-59.5%
Contains
more
Mono. Fat Monounsaturated fat
+481%
Contains
more
Poly. Fat Polyunsaturated fat
+2885.4%