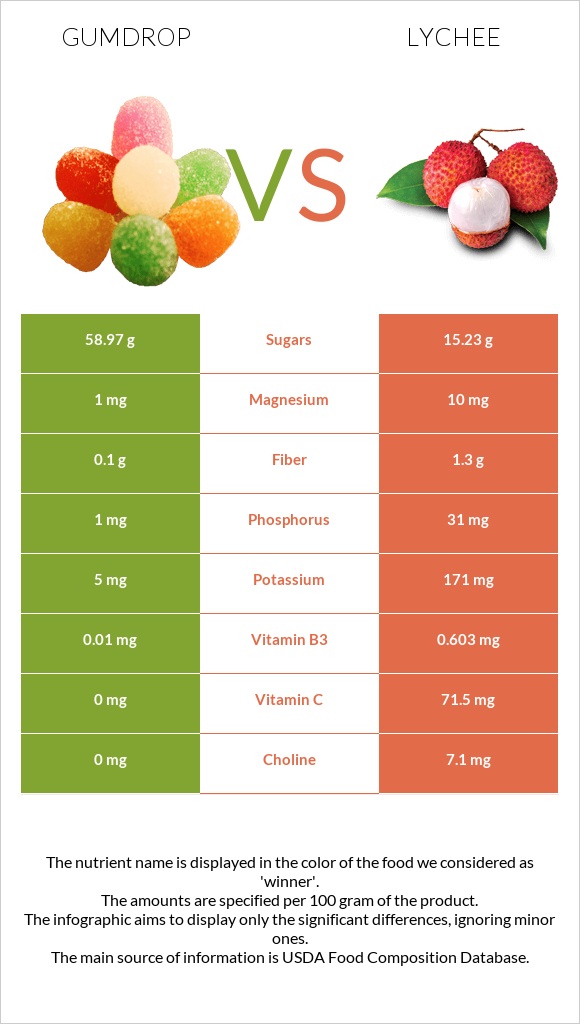
Significant differences between gumdrop and lychee The amount of vitamin C, copper, and vitamin B6 in lychee is higher than in gumdrop. Lychee covers your daily vitamin C needs 79% more than gumdrop. Lychee has 4 times less sugar than gumdrop. Gumdrop has 58.97g of sugar, while lychee has 15.23g. Gumdrop has a higher glycemic index. The glycemic index of gumdrop is 78, while the glycemic index of lychee is 48. Specific food types used in this comparison are Candies, gumdrops, starch jelly pieces and Litchis, raw .
Infographic
Mineral Comparison
Mineral comparison score is based on the number of minerals by which one or the other food is richer. The "coverage" charts below show how much of the daily needs can be covered by 300 grams of the food.
2
100 g
300 g
1 gumdrop, small (1/2" dia) - 3.2g 1 gumdrop, medium (3/4" dia) - 4.2g 1 spice stick - 9.5g 1 jelly ring (1-1/4" dia) - 10g 1 gumdrop, large (1" dia) - 11.6g 10 gummy bears - 22g 1 spice drop - 24g 10 gumdrops - 36g 10 gummy fish - 50g 10 gummy dinosaurs - 63g 10 gummy worms - 74g 1 cup gumdrops - 182g
Magnesium
Magnesium
Calcium
Calcium
Potassium
Potassium
Iron
Iron
Copper
Copper
Zinc
Zinc
Phosphorus
Phosphorus
Sodium
Sodium
Manganese
Manganese
Selenium
Selenium
0.71%
0.9%
0.44%
15%
4%
0%
0.43%
5.7%
1.3%
4.4%
8
100 g
300 g
1 fruit without refuse - 9.6g 1 cup - 190g
Magnesium
Magnesium
Calcium
Calcium
Potassium
Potassium
Iron
Iron
Copper
Copper
Zinc
Zinc
Phosphorus
Phosphorus
Sodium
Sodium
Manganese
Manganese
Selenium
Selenium
7.1%
1.5%
15%
12%
49%
1.9%
13%
0.13%
7.2%
3.3%
Vitamin Comparison
Vitamin comparison score is based on the number of vitamins by which one or the other food is richer. The "coverage" charts below show how much of the daily needs can be covered by 300 grams of the food.
1
100 g
300 g
1 gumdrop, small (1/2" dia) - 3.2g 1 gumdrop, medium (3/4" dia) - 4.2g 1 spice stick - 9.5g 1 jelly ring (1-1/4" dia) - 10g 1 gumdrop, large (1" dia) - 11.6g 10 gummy bears - 22g 1 spice drop - 24g 10 gumdrops - 36g 10 gummy fish - 50g 10 gummy dinosaurs - 63g 10 gummy worms - 74g 1 cup gumdrops - 182g
Vitamin C
Vit. C
Vitamin D
Vit. D
Vitamin A
Vit. A
Vitamin E
Vit. E
Vitamin B1
Vit. B1
Vitamin B2
Vit. B2
Vitamin B3
Vit. B3
Vitamin B5
Vit. B5
Vitamin B6
Vit. B6
Vitamin B12
Vit. B12
Vitamin K
Vit. K
Folate
Folate
0%
0%
0%
0%
1.5%
3%
0.19%
0.72%
1.2%
0%
0%
0%
8
100 g
300 g
1 fruit without refuse - 9.6g 1 cup - 190g
Vitamin C
Vit. C
Vitamin D
Vit. D
Vitamin A
Vit. A
Vitamin E
Vit. E
Vitamin B1
Vit. B1
Vitamin B2
Vit. B2
Vitamin B3
Vit. B3
Vitamin B5
Vit. B5
Vitamin B6
Vit. B6
Vitamin B12
Vit. B12
Vitamin K
Vit. K
Folate
Folate
238%
0%
0%
1.4%
2.8%
15%
11%
0%
23%
0%
1%
11%
All nutrients comparison - raw data values
Nutrient
DV% diff.
Vitamin C
0mg
71.5mg
79%
Carbs
98.9g
16.53g
27%
Calories
396kcal
66kcal
17%
Copper
0.012mg
0.148mg
15%
Vitamin B6
0.005mg
0.1mg
7%
Potassium
5mg
171mg
5%
Fiber
0.1g
1.3g
5%
Phosphorus
1mg
31mg
4%
Vitamin B2
0.013mg
0.065mg
4%
Vitamin B3
0.01mg
0.603mg
4%
Folate
0µg
14µg
4%
Protein
0g
0.83g
2%
Magnesium
1mg
10mg
2%
Sodium
44mg
1mg
2%
Manganese
0.01mg
0.055mg
2%
Fats
0g
0.44g
1%
Iron
0.4mg
0.31mg
1%
Zinc
0mg
0.07mg
1%
Choline
0mg
7.1mg
1%
Polyunsaturated fat
0g
0.132g
1%
Protein per 100 calories
0g
1.3g
N/A
Calories per 10 g protein
795kcal
N/A
Weight per 100 calories
25g
152g
N/A
Net carbs
98.8g
15.23g
N/A
Calcium
3mg
5mg
0%
Sugar
58.97g
15.23g
N/A
Vitamin E
0mg
0.07mg
0%
Selenium
0.8µg
0.6µg
0%
Vitamin B1
0.006mg
0.011mg
0%
Vitamin B5
0.012mg
0%
Vitamin K
0µg
0.4µg
0%
Saturated fat
0g
0.099g
0%
Monounsaturated fat
0g
0.12g
0%
Tryptophan
0.007mg
0%
Lysine
0.041mg
0%
Methionine
0.009mg
0%
Macronutrient Comparison
Macronutrient breakdown side-by-side comparison
1
99%
Protein:
0 g
Fats:
0 g
Carbs:
98.9 g
Water:
1 g
Other:
0.1 g
4
17%
82%
Protein:
0.83 g
Fats:
0.44 g
Carbs:
16.53 g
Water:
81.76 g
Other:
0.44 g
Contains
more
Carbs Carbs
+498.3%
Contains
more
Protein Protein
+∞%
Contains
more
Fats Fats
+∞%
Contains
more
Water Water
+8076%
Contains
more
Other Other
+340%