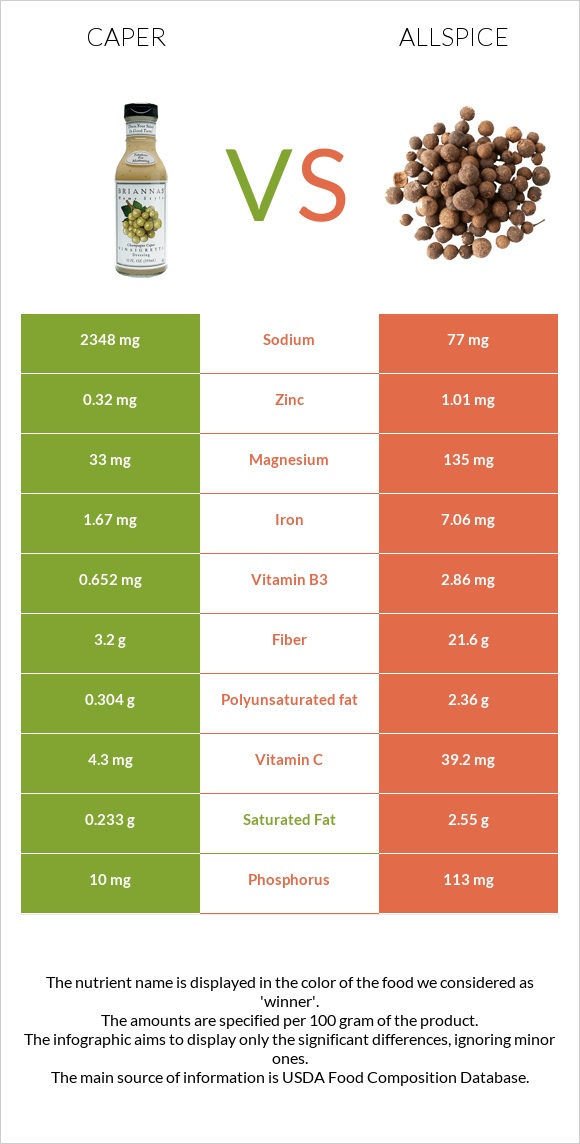
A recap on the differences between caper and allspice Caper has less manganese, fiber, iron, calcium, vitamin C, potassium, magnesium, copper, and phosphorus. Allspice covers your daily manganese needs 125% more than caper. Allspice contains 30 times less sodium than caper. Caper contains 2348mg of sodium, while allspice contains 77mg. Food varieties used in this article are Capers, canned and Spices, allspice, ground .
Infographic
Mineral Comparison
Mineral comparison score is based on the number of minerals by which one or the other food is richer. The "coverage" charts below show how much of the daily needs can be covered by 300 grams of the food.
0
100 g
300 g
1 tbsp, drained - 8.6g
Magnesium
Magnesium
Calcium
Calcium
Potassium
Potassium
Iron
Iron
Copper
Copper
Zinc
Zinc
Phosphorus
Phosphorus
Sodium
Sodium
Manganese
Manganese
Selenium
Selenium
24%
12%
3.5%
63%
125%
8.7%
4.3%
306%
10%
6.5%
10
100 g
300 g
0.25 tsp - 0.5g 1 tsp - 1.9g 1 tbsp - 6g
Magnesium
Magnesium
Calcium
Calcium
Potassium
Potassium
Iron
Iron
Copper
Copper
Zinc
Zinc
Phosphorus
Phosphorus
Sodium
Sodium
Manganese
Manganese
Selenium
Selenium
96%
198%
92%
265%
184%
28%
48%
10%
384%
15%
Vitamin Comparison
Vitamin comparison score is based on the number of vitamins by which one or the other food is richer. The "coverage" charts below show how much of the daily needs can be covered by 300 grams of the food.
4
100 g
300 g
1 tbsp, drained - 8.6g
Vitamin C
Vit. C
Vitamin D
Vit. D
Vitamin A
Vit. A
Vitamin E
Vit. E
Vitamin B1
Vit. B1
Vitamin B2
Vit. B2
Vitamin B3
Vit. B3
Vitamin B5
Vit. B5
Vitamin B6
Vit. B6
Vitamin B12
Vit. B12
Vitamin K
Vit. K
Folate
Folate
14%
0%
2.3%
18%
4.5%
32%
12%
1.6%
5.3%
0%
62%
17%
6
100 g
300 g
0.25 tsp - 0.5g 1 tsp - 1.9g 1 tbsp - 6g
Vitamin C
Vit. C
Vitamin D
Vit. D
Vitamin A
Vit. A
Vitamin E
Vit. E
Vitamin B1
Vit. B1
Vitamin B2
Vit. B2
Vitamin B3
Vit. B3
Vitamin B5
Vit. B5
Vitamin B6
Vit. B6
Vitamin B12
Vit. B12
Vitamin K
Vit. K
Folate
Folate
131%
0%
9%
0%
25%
15%
54%
0%
48%
0%
0%
27%
All nutrients comparison - raw data values
Nutrient
DV% diff.
Manganese
0.078mg
2.943mg
125%
Sodium
2348mg
77mg
99%
Fiber
3.2g
21.6g
74%
Iron
1.67mg
7.06mg
67%
Calcium
40mg
661mg
62%
Vitamin C
4.3mg
39.2mg
39%
Potassium
40mg
1044mg
30%
Magnesium
33mg
135mg
24%
Carbs
4.89g
72.12g
22%
Vitamin K
24.6µg
21%
Copper
0.374mg
0.553mg
20%
Phosphorus
10mg
113mg
15%
Vitamin B3
0.652mg
2.86mg
14%
Vitamin B6
0.023mg
0.21mg
14%
Polyunsaturated fat
0.304g
2.36g
14%
Calories
23kcal
263kcal
12%
Fats
0.86g
8.69g
12%
Saturated fat
0.233g
2.55g
11%
Protein
2.36g
6.09g
7%
Vitamin B1
0.018mg
0.101mg
7%
Zinc
0.32mg
1.01mg
6%
Vitamin E
0.88mg
6%
Vitamin B2
0.139mg
0.063mg
6%
Selenium
1.2µg
2.7µg
3%
Folate
23µg
36µg
3%
Vitamin A
7µg
27µg
2%
Vitamin B5
0.027mg
1%
Choline
6.5mg
1%
Monounsaturated fat
0.063g
0.66g
1%
Protein per 100 calories
10g
2.3g
N/A
Calories per 10 g protein
97kcal
432kcal
N/A
Weight per 100 calories
435g
38g
N/A
Unsaturated / Saturated Fat ratio
1.6
1.2
N/A
Net carbs
1.69g
50.52g
N/A
Sugar
0.41g
N/A
Omega-3 - DPA
0.001g
0g
N/A
Macronutrient Comparison
Macronutrient breakdown side-by-side comparison
2
2%
5%
84%
8%
Protein:
2.36 g
Fats:
0.86 g
Carbs:
4.89 g
Water:
83.85 g
Other:
8.04 g
3
6%
9%
72%
8%
5%
Protein:
6.09 g
Fats:
8.69 g
Carbs:
72.12 g
Water:
8.46 g
Other:
4.64 g
Contains
more
Water Water
+891.1%
Contains
more
Other Other
+73.3%
Contains
more
Protein Protein
+158.1%
Contains
more
Fats Fats
+910.5%
Contains
more
Carbs Carbs
+1374.8%
Fat Type Comparison
Fat type breakdown side-by-side comparison
1
39%
11%
51%
Saturated fat:
Sat. Fat
0.233 g
Monounsaturated fat:
Mono. Fat
0.063 g
Polyunsaturated fat:
Poly. Fat
0.304 g
2
46%
12%
42%
Saturated fat:
Sat. Fat
2.55 g
Monounsaturated fat:
Mono. Fat
0.66 g
Polyunsaturated fat:
Poly. Fat
2.36 g
Contains
less
Sat. Fat Saturated fat
-90.9%
Contains
more
Mono. Fat Monounsaturated fat
+947.6%
Contains
more
Poly. Fat Polyunsaturated fat
+676.3%