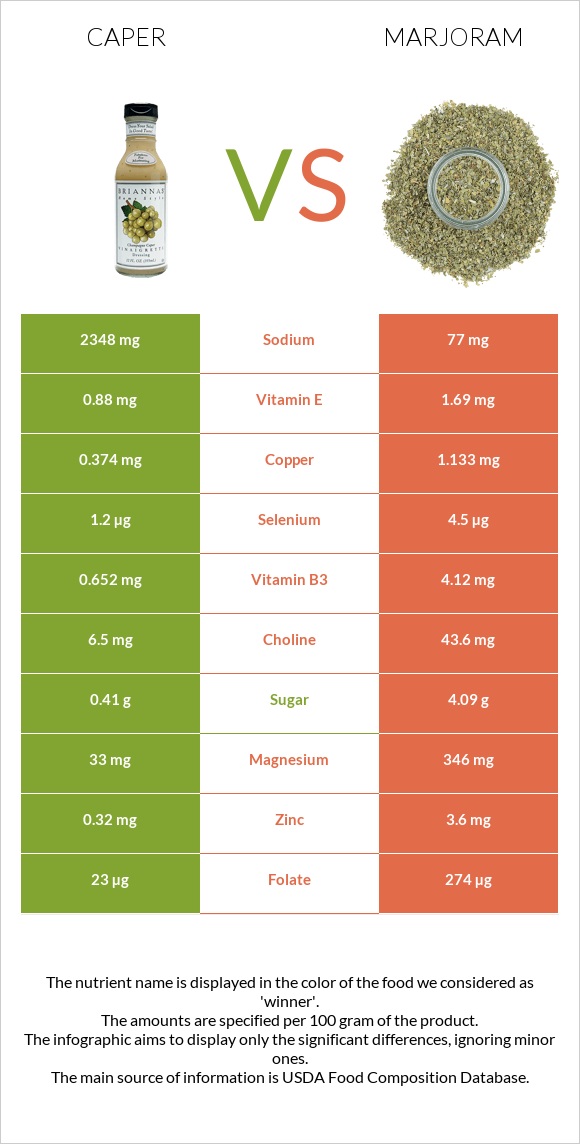
What are the differences between caper and marjoram? Marjoram is richer than caper in iron, vitamin K, manganese, calcium, vitamin A, fiber, vitamin B6, copper, and magnesium. Marjoram's daily need coverage for iron is 1013% more. Caper has 30 times more sodium than marjoram. While caper has 2348mg of sodium, marjoram has only 77mg. We used Capers, canned and Spices, marjoram, dried types in this article.
Infographic
Mineral Comparison
Mineral comparison score is based on the number of minerals by which one or the other food is richer. The "coverage" charts below show how much of the daily needs can be covered by 300 grams of the food.
0
100 g
300 g
1 tbsp, drained - 8.6g
Magnesium
Magnesium
Calcium
Calcium
Potassium
Potassium
Iron
Iron
Copper
Copper
Zinc
Zinc
Phosphorus
Phosphorus
Sodium
Sodium
Manganese
Manganese
Selenium
Selenium
24%
12%
3.5%
63%
125%
8.7%
4.3%
306%
10%
6.5%
10
100 g
300 g
1 tsp - 0.6g 1 tbsp - 1.7g
Magnesium
Magnesium
Calcium
Calcium
Potassium
Potassium
Iron
Iron
Copper
Copper
Zinc
Zinc
Phosphorus
Phosphorus
Sodium
Sodium
Manganese
Manganese
Selenium
Selenium
247%
597%
134%
3102%
378%
98%
131%
10%
709%
25%
Vitamin Comparison
Vitamin comparison score is based on the number of vitamins by which one or the other food is richer. The "coverage" charts below show how much of the daily needs can be covered by 300 grams of the food.
1
100 g
300 g
1 tbsp, drained - 8.6g
Vitamin C
Vit. C
Vitamin D
Vit. D
Vitamin A
Vit. A
Vitamin E
Vit. E
Vitamin B1
Vit. B1
Vitamin B2
Vit. B2
Vitamin B3
Vit. B3
Vitamin B5
Vit. B5
Vitamin B6
Vit. B6
Vitamin B12
Vit. B12
Vitamin K
Vit. K
Folate
Folate
14%
0%
2.3%
18%
4.5%
32%
12%
1.6%
5.3%
0%
62%
17%
9
100 g
300 g
1 tsp - 0.6g 1 tbsp - 1.7g
Vitamin C
Vit. C
Vitamin D
Vit. D
Vitamin A
Vit. A
Vitamin E
Vit. E
Vitamin B1
Vit. B1
Vitamin B2
Vit. B2
Vitamin B3
Vit. B3
Vitamin B5
Vit. B5
Vitamin B6
Vit. B6
Vitamin B12
Vit. B12
Vitamin K
Vit. K
Folate
Folate
171%
0%
134%
34%
72%
73%
77%
0%
275%
0%
1554%
206%
All nutrients comparison - raw data values
Nutrient
DV% diff.
Iron
1.67mg
82.71mg
1013%
Vitamin K
24.6µg
621.7µg
498%
Manganese
0.078mg
5.433mg
233%
Calcium
40mg
1990mg
195%
Fiber
3.2g
40.3g
148%
Sodium
2348mg
77mg
99%
Vitamin B6
0.023mg
1.19mg
90%
Copper
0.374mg
1.133mg
84%
Magnesium
33mg
346mg
75%
Folate
23µg
274µg
63%
Vitamin C
4.3mg
51.4mg
52%
Potassium
40mg
1522mg
44%
Vitamin A
7µg
403µg
44%
Phosphorus
10mg
306mg
42%
Zinc
0.32mg
3.6mg
30%
Polyunsaturated fat
0.304g
4.405g
27%
Vitamin B1
0.018mg
0.289mg
23%
Vitamin B3
0.652mg
4.12mg
22%
Protein
2.36g
12.66g
21%
Carbs
4.89g
60.56g
19%
Vitamin B2
0.139mg
0.316mg
14%
Calories
23kcal
271kcal
12%
Fats
0.86g
7.04g
10%
Choline
6.5mg
43.6mg
7%
Selenium
1.2µg
4.5µg
6%
Vitamin E
0.88mg
1.69mg
5%
Monounsaturated fat
0.063g
0.94g
2%
Vitamin B5
0.027mg
1%
Saturated fat
0.233g
0.529g
1%
Protein per 100 calories
10g
4.7g
N/A
Calories per 10 g protein
97kcal
214kcal
N/A
Weight per 100 calories
435g
37g
N/A
Unsaturated / Saturated Fat ratio
1.6
10
N/A
Net carbs
1.69g
20.26g
N/A
Sugar
0.41g
4.09g
N/A
Omega-3 - DPA
0.001g
0g
N/A
Macronutrient Comparison
Macronutrient breakdown side-by-side comparison
1
2%
5%
84%
8%
Protein:
2.36 g
Fats:
0.86 g
Carbs:
4.89 g
Water:
83.85 g
Other:
8.04 g
4
13%
7%
61%
8%
12%
Protein:
12.66 g
Fats:
7.04 g
Carbs:
60.56 g
Water:
7.64 g
Other:
12.1 g
Contains
more
Water Water
+997.5%
Contains
more
Protein Protein
+436.4%
Contains
more
Fats Fats
+718.6%
Contains
more
Carbs Carbs
+1138.4%
Contains
more
Other Other
+50.5%
Fat Type Comparison
Fat type breakdown side-by-side comparison
1
39%
11%
51%
Saturated fat:
Sat. Fat
0.233 g
Monounsaturated fat:
Mono. Fat
0.063 g
Polyunsaturated fat:
Poly. Fat
0.304 g
2
9%
16%
75%
Saturated fat:
Sat. Fat
0.529 g
Monounsaturated fat:
Mono. Fat
0.94 g
Polyunsaturated fat:
Poly. Fat
4.405 g
Contains
less
Sat. Fat Saturated fat
-56%
Contains
more
Mono. Fat Monounsaturated fat
+1392.1%
Contains
more
Poly. Fat Polyunsaturated fat
+1349%