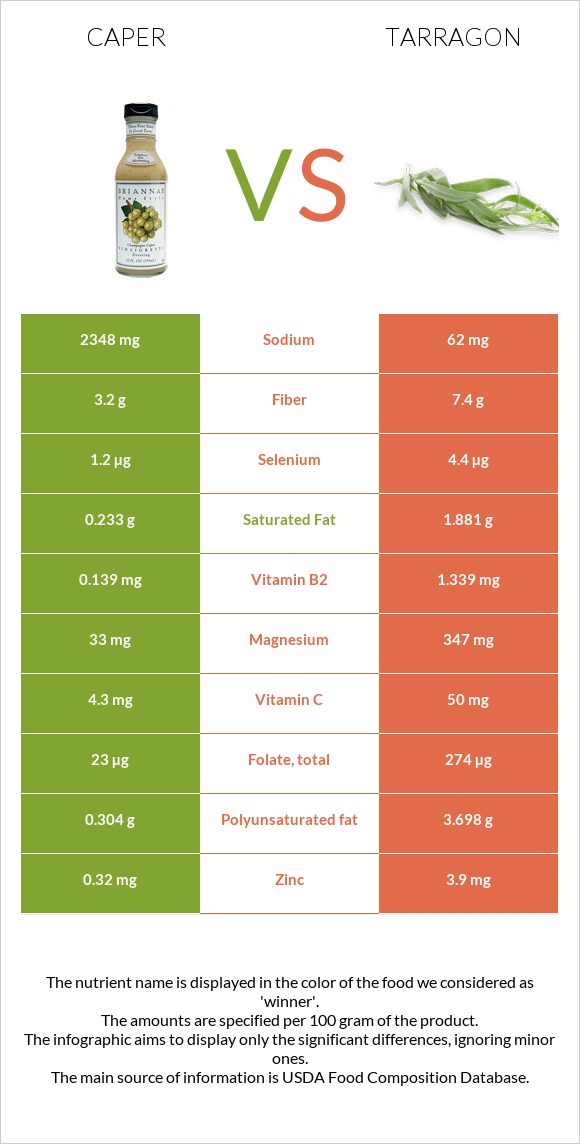
A recap on the differences between caper and tarragon Caper has less iron, manganese, vitamin B6, calcium, vitamin B2, potassium, vitamin A, magnesium, and folate. Tarragon covers your daily iron needs 383% more than caper. Tarragon contains 38 times less sodium than caper. Caper contains 2348mg of sodium, while tarragon contains 62mg. Food varieties used in this article are Capers, canned and Spices, tarragon, dried .
Infographic
Mineral Comparison
Mineral comparison score is based on the number of minerals by which one or the other food is richer. The "coverage" charts below show how much of the daily needs can be covered by 300 grams of the food.
0
100 g
300 g
1 tbsp, drained - 8.6g
Magnesium
Magnesium
Calcium
Calcium
Potassium
Potassium
Iron
Iron
Copper
Copper
Zinc
Zinc
Phosphorus
Phosphorus
Sodium
Sodium
Manganese
Manganese
Selenium
Selenium
24%
12%
3.5%
63%
125%
8.7%
4.3%
306%
10%
6.5%
10
100 g
300 g
0.25 tsp - 0.5g 1 tsp, ground - 1.6g 1 tbsp, leaves - 1.8g 1 tbsp, ground - 4.8g
Magnesium
Magnesium
Calcium
Calcium
Potassium
Potassium
Iron
Iron
Copper
Copper
Zinc
Zinc
Phosphorus
Phosphorus
Sodium
Sodium
Manganese
Manganese
Selenium
Selenium
248%
342%
266%
1211%
226%
106%
134%
8.1%
1039%
24%
Vitamin Comparison
Vitamin comparison score is based on the number of vitamins by which one or the other food is richer. The "coverage" charts below show how much of the daily needs can be covered by 300 grams of the food.
3
100 g
300 g
1 tbsp, drained - 8.6g
Vitamin C
Vit. C
Vitamin D
Vit. D
Vitamin A
Vit. A
Vitamin E
Vit. E
Vitamin B1
Vit. B1
Vitamin B2
Vit. B2
Vitamin B3
Vit. B3
Vitamin B5
Vit. B5
Vitamin B6
Vit. B6
Vitamin B12
Vit. B12
Vitamin K
Vit. K
Folate
Folate
14%
0%
2.3%
18%
4.5%
32%
12%
1.6%
5.3%
0%
62%
17%
7
100 g
300 g
0.25 tsp - 0.5g 1 tsp, ground - 1.6g 1 tbsp, leaves - 1.8g 1 tbsp, ground - 4.8g
Vitamin C
Vit. C
Vitamin D
Vit. D
Vitamin A
Vit. A
Vitamin E
Vit. E
Vitamin B1
Vit. B1
Vitamin B2
Vit. B2
Vitamin B3
Vit. B3
Vitamin B5
Vit. B5
Vitamin B6
Vit. B6
Vitamin B12
Vit. B12
Vitamin K
Vit. K
Folate
Folate
167%
0%
70%
0%
63%
309%
168%
0%
556%
0%
0%
206%
All nutrients comparison - raw data values
Nutrient
DV% diff.
Iron
1.67mg
32.3mg
383%
Manganese
0.078mg
7.967mg
343%
Vitamin B6
0.023mg
2.41mg
184%
Calcium
40mg
1139mg
110%
Sodium
2348mg
62mg
99%
Vitamin B2
0.139mg
1.339mg
92%
Potassium
40mg
3020mg
88%
Magnesium
33mg
347mg
75%
Folate
23µg
274µg
63%
Vitamin B3
0.652mg
8.95mg
52%
Vitamin C
4.3mg
50mg
51%
Phosphorus
10mg
313mg
43%
Protein
2.36g
22.77g
41%
Copper
0.374mg
0.677mg
34%
Zinc
0.32mg
3.9mg
33%
Vitamin A
7µg
210µg
23%
Polyunsaturated fat
0.304g
3.698g
23%
Vitamin K
24.6µg
21%
Vitamin B1
0.018mg
0.251mg
19%
Fiber
3.2g
7.4g
17%
Carbs
4.89g
50.22g
15%
Calories
23kcal
295kcal
14%
Fats
0.86g
7.24g
10%
Saturated fat
0.233g
1.881g
7%
Vitamin E
0.88mg
6%
Selenium
1.2µg
4.4µg
6%
Vitamin B5
0.027mg
1%
Choline
6.5mg
1%
Monounsaturated fat
0.063g
0.474g
1%
Protein per 100 calories
10g
7.7g
N/A
Calories per 10 g protein
97kcal
130kcal
N/A
Weight per 100 calories
435g
34g
N/A
Unsaturated / Saturated Fat ratio
1.6
2.2
N/A
Net carbs
1.69g
42.82g
N/A
Sugar
0.41g
N/A
Omega-3 - DPA
0.001g
0g
N/A
Macronutrient Comparison
Macronutrient breakdown side-by-side comparison
1
2%
5%
84%
8%
Protein:
2.36 g
Fats:
0.86 g
Carbs:
4.89 g
Water:
83.85 g
Other:
8.04 g
4
23%
7%
50%
8%
12%
Protein:
22.77 g
Fats:
7.24 g
Carbs:
50.22 g
Water:
7.74 g
Other:
12.03 g
Contains
more
Water Water
+983.3%
Contains
more
Protein Protein
+864.8%
Contains
more
Fats Fats
+741.9%
Contains
more
Carbs Carbs
+927%
Contains
more
Other Other
+49.6%
Fat Type Comparison
Fat type breakdown side-by-side comparison
1
39%
11%
51%
Saturated fat:
Sat. Fat
0.233 g
Monounsaturated fat:
Mono. Fat
0.063 g
Polyunsaturated fat:
Poly. Fat
0.304 g
2
31%
8%
61%
Saturated fat:
Sat. Fat
1.881 g
Monounsaturated fat:
Mono. Fat
0.474 g
Polyunsaturated fat:
Poly. Fat
3.698 g
Contains
less
Sat. Fat Saturated fat
-87.6%
Contains
more
Mono. Fat Monounsaturated fat
+652.4%
Contains
more
Poly. Fat Polyunsaturated fat
+1116.4%