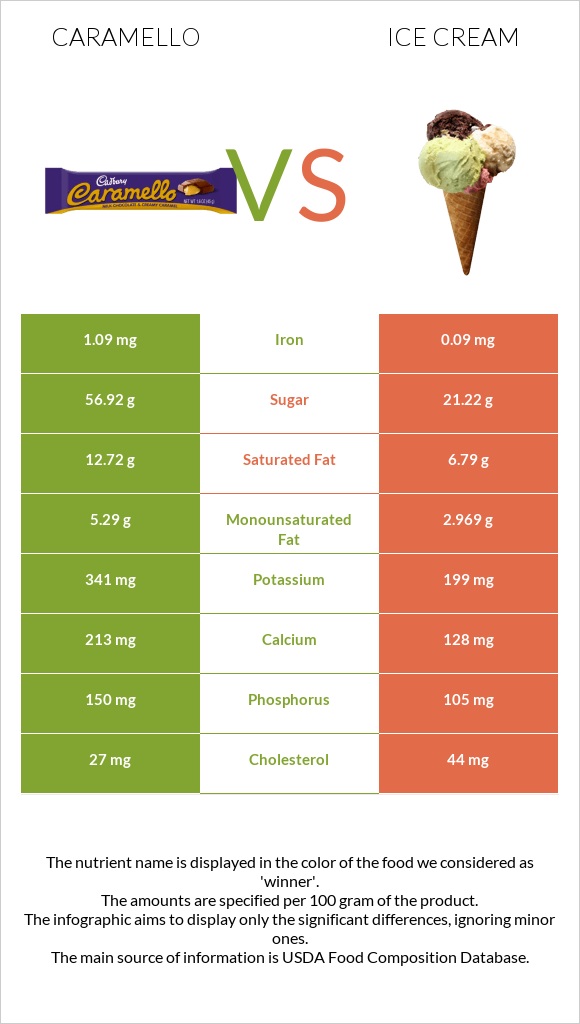
Significant differences between caramello and ice cream The amount of iron, calcium, phosphorus, and monounsaturated fat in caramello is higher than in ice cream. Caramello covers your daily saturated fat needs 30% more than ice cream. Ice cream has 12 times less iron than caramello. Caramello has 1.09mg of iron, while ice cream has 0.09mg. Ice cream contains less sugar. Specific food types used in this comparison are Candies, CARAMELLO Candy Bar and Ice creams, vanilla .
Infographic
Mineral Comparison
Mineral comparison score is based on the number of minerals by which one or the other food is richer. The "coverage" charts below show how much of the daily needs can be covered by 300 grams of the food.
4
100 g
300 g
1 bar 1.25 oz - 35g 6 blocks - 43g 1 bar 1.6 oz - 45g
Magnesium
Magnesium
Calcium
Calcium
Potassium
Potassium
Iron
Iron
Copper
Copper
Zinc
Zinc
Phosphorus
Phosphorus
Sodium
Sodium
Manganese
Manganese
Selenium
Selenium
0%
64%
30%
41%
0%
0%
64%
16%
0%
0%
6
100 g
300 g
1 serving 1/2 cup - 66g
Magnesium
Magnesium
Calcium
Calcium
Potassium
Potassium
Iron
Iron
Copper
Copper
Zinc
Zinc
Phosphorus
Phosphorus
Sodium
Sodium
Manganese
Manganese
Selenium
Selenium
10%
38%
18%
3.4%
7.7%
19%
45%
10%
1%
9.8%
Vitamin Comparison
Vitamin comparison score is based on the number of vitamins by which one or the other food is richer. The "coverage" charts below show how much of the daily needs can be covered by 300 grams of the food.
1
100 g
300 g
1 bar 1.25 oz - 35g 6 blocks - 43g 1 bar 1.6 oz - 45g
Vitamin C
Vit. C
Vitamin D
Vit. D
Vitamin A
Vit. A
Vitamin E
Vit. E
Vitamin B1
Vit. B1
Vitamin B2
Vit. B2
Vitamin B3
Vit. B3
Vitamin B5
Vit. B5
Vitamin B6
Vit. B6
Vitamin B12
Vit. B12
Vitamin K
Vit. K
Folate
Folate
5.7%
0%
0%
0%
0%
0%
0%
0%
0%
0%
0%
0%
11
100 g
300 g
1 serving 1/2 cup - 66g
Vitamin C
Vit. C
Vitamin D
Vit. D
Vitamin A
Vit. A
Vitamin E
Vit. E
Vitamin B1
Vit. B1
Vitamin B2
Vit. B2
Vitamin B3
Vit. B3
Vitamin B5
Vit. B5
Vitamin B6
Vit. B6
Vitamin B12
Vit. B12
Vitamin K
Vit. K
Folate
Folate
2%
3%
39%
6%
10%
55%
2.2%
35%
11%
49%
0.75%
3.8%
All nutrients comparison - raw data values
Nutrient
DV% diff.
Saturated fat
12.72g
6.79g
27%
Vitamin B2
0.24mg
18%
Fats
21.19g
11g
16%
Vitamin B12
0.39µg
16%
Calories
462kcal
207kcal
13%
Carbs
63.81g
23.6g
13%
Iron
1.09mg
0.09mg
13%
Vitamin A
118µg
13%
Vitamin B5
0.581mg
12%
Calcium
213mg
128mg
9%
Cholesterol
27mg
44mg
6%
Zinc
0.69mg
6%
Phosphorus
150mg
105mg
6%
Monounsaturated fat
5.29g
2.969g
6%
Protein
6.19g
3.5g
5%
Choline
26mg
5%
Potassium
341mg
199mg
4%
Vitamin B6
0.048mg
4%
Magnesium
14mg
3%
Copper
0.023mg
3%
Selenium
1.8µg
3%
Vitamin B1
0.041mg
3%
Fiber
1.2g
0.7g
2%
Sodium
122mg
80mg
2%
Vitamin E
0.3mg
2%
Vitamin C
1.7mg
0.6mg
1%
Vitamin D*
8 IU
1%
Vitamin D
0.2µg
1%
Vitamin B3
0.116mg
1%
Folate
5µg
1%
Polyunsaturated fat
0.63g
0.452g
1%
Protein per 100 calories
1.3g
1.7g
N/A
Calories per 10 g protein
746kcal
591kcal
N/A
Weight per 100 calories
22g
48g
N/A
Unsaturated / Saturated Fat ratio
0.47
0.5
N/A
Net carbs
62.61g
22.9g
N/A
Sugar
56.92g
21.22g
N/A
Manganese
0.008mg
0%
Vitamin K
0.3µg
0%
Tryptophan
0.045mg
0%
Threonine
0.146mg
0%
Isoleucine
0.195mg
0%
Leucine
0.316mg
0%
Lysine
0.258mg
0%
Methionine
0.081mg
0%
Phenylalanine
0.157mg
0%
Valine
0.217mg
0%
Histidine
0.088mg
0%
Omega-3 - EPA
0.003g
N/A
Macronutrient Comparison
Macronutrient breakdown side-by-side comparison
4
6%
21%
64%
7%
2%
Protein:
6.19 g
Fats:
21.19 g
Carbs:
63.81 g
Water:
6.79 g
Other:
2.02 g
1
4%
11%
24%
61%
Protein:
3.5 g
Fats:
11 g
Carbs:
23.6 g
Water:
61 g
Other:
0.9 g
Contains
more
Protein Protein
+76.9%
Contains
more
Fats Fats
+92.6%
Contains
more
Carbs Carbs
+170.4%
Contains
more
Other Other
+124.4%
Contains
more
Water Water
+798.4%
Fat Type Comparison
Fat type breakdown side-by-side comparison
2
68%
28%
3%
Saturated fat:
Sat. Fat
12.72 g
Monounsaturated fat:
Mono. Fat
5.29 g
Polyunsaturated fat:
Poly. Fat
0.63 g
1
66%
29%
4%
Saturated fat:
Sat. Fat
6.79 g
Monounsaturated fat:
Mono. Fat
2.969 g
Polyunsaturated fat:
Poly. Fat
0.452 g
Contains
more
Mono. Fat Monounsaturated fat
+78.2%
Contains
more
Poly. Fat Polyunsaturated fat
+39.4%
Contains
less
Sat. Fat Saturated fat
-46.6%