Cereal vs. Cowpea (Black-eyed pea) — In-Depth Nutrition Comparison
Compare
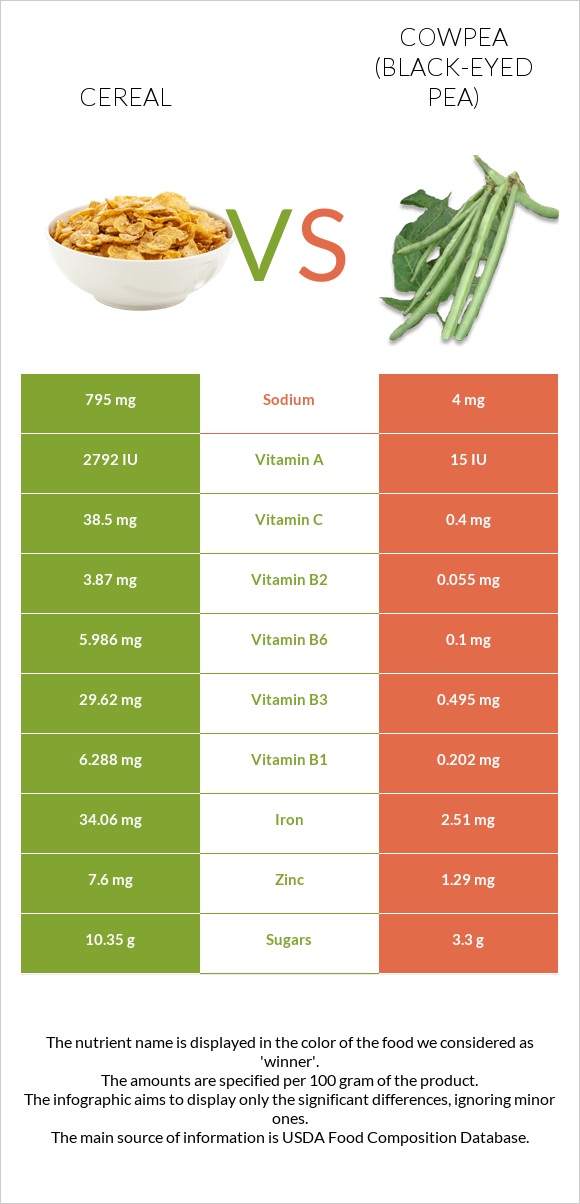
Differences between cereal and cowpea (Black-eyed pea)
- Cereal has more vitamin B1, vitamin B6, iron, vitamin B2, vitamin B3, zinc, vitamin A, and vitamin C, while cowpea (Black-eyed pea) has more fiber.
- Cereal's daily need coverage for vitamin B1 is 507% higher.
- Cowpea (Black-eyed pea) contains 199 times less sodium than cereal. Cereal contains 795mg of sodium, while cowpea (Black-eyed pea) contains 4mg.
- Cowpea (Black-eyed pea) has a lower glycemic index. The glycemic index of cowpea (Black-eyed pea) is 52, while the glycemic index of cereal is 69.
The food types used in this comparison are Cereals ready-to-eat, USDA Commodity Corn and Rice (includes all commodity brands) and Cowpeas, common (blackeyes, crowder, southern), mature seeds, cooked, boiled, without salt.
Infographic
Infographic link
Mineral Comparison
Mineral comparison score is based on the number of minerals by which one or the other food is richer. The "coverage" charts below show how much of the daily needs can be covered by 300 grams of the food.
| Contains more IronIron | +1257% |
| Contains more ZincZinc | +489.1% |
| Contains more ManganeseManganese | +66.3% |
| Contains more SeleniumSelenium | +152% |
| Contains more MagnesiumMagnesium | +178.9% |
| Contains more CalciumCalcium | +140% |
| Contains more PotassiumPotassium | +164.8% |
| Contains more CopperCopper | +95.6% |
| Contains more PhosphorusPhosphorus | +102.6% |
| Contains less SodiumSodium | -99.5% |
Vitamin Comparison
Vitamin comparison score is based on the number of vitamins by which one or the other food is richer. The "coverage" charts below show how much of the daily needs can be covered by 300 grams of the food.
| Contains more Vitamin CVitamin C | +9525% |
| Contains more Vitamin AVitamin A | +81300% |
| Contains more Vitamin B1Vitamin B1 | +3012.9% |
| Contains more Vitamin B2Vitamin B2 | +6936.4% |
| Contains more Vitamin B3Vitamin B3 | +5883.8% |
| Contains more Vitamin B6Vitamin B6 | +5886% |
| Contains more Vitamin EVitamin E | +250% |
| Contains more Vitamin B5Vitamin B5 | +81.9% |
| Contains more Vitamin KVitamin K | +∞% |
All nutrients comparison - raw data values
| Nutrient |  |
 |
DV% diff. |
| Vitamin B1 | 6.288mg | 0.202mg | 507% |
| Vitamin B6 | 5.986mg | 0.1mg | 453% |
| Iron | 34.06mg | 2.51mg | 394% |
| Vitamin B2 | 3.87mg | 0.055mg | 293% |
| Vitamin B3 | 29.62mg | 0.495mg | 182% |
| Vitamin A | 814µg | 1µg | 90% |
| Zinc | 7.6mg | 1.29mg | 57% |
| Folate | 208µg | 52% | |
| Vitamin C | 38.5mg | 0.4mg | 42% |
| Sodium | 795mg | 4mg | 34% |
| Carbs | 86.85g | 20.76g | 22% |
| Fiber | 1.4g | 6.5g | 20% |
| Copper | 0.137mg | 0.268mg | 15% |
| Manganese | 0.79mg | 0.475mg | 14% |
| Calories | 378kcal | 116kcal | 13% |
| Phosphorus | 77mg | 156mg | 11% |
| Magnesium | 19mg | 53mg | 8% |
| Selenium | 6.3µg | 2.5µg | 7% |
| Choline | 32.2mg | 6% | |
| Potassium | 105mg | 278mg | 5% |
| Vitamin B5 | 0.226mg | 0.411mg | 4% |
| Protein | 6.06g | 7.73g | 3% |
| Fats | 1.08g | 0.53g | 1% |
| Calcium | 10mg | 24mg | 1% |
| Vitamin E | 0.08mg | 0.28mg | 1% |
| Vitamin K | 0µg | 1.7µg | 1% |
| Saturated fat | 0.26g | 0.138g | 1% |
| Polyunsaturated fat | 0.354g | 0.225g | 1% |
| Protein per 100 calories | 1.6g | 6.7g | N/A |
| Calories per 10 g protein | 624kcal | 150kcal | N/A |
| Weight per 100 calories | 26g | 86g | N/A |
| Net carbs | 85.45g | 14.26g | N/A |
| Sugar | 10.35g | 3.3g | N/A |
| Monounsaturated fat | 0.204g | 0.044g | 0% |
| Tryptophan | 0.066mg | 0.095mg | 0% |
| Threonine | 0.241mg | 0.294mg | 0% |
| Isoleucine | 0.26mg | 0.314mg | 0% |
| Leucine | 0.767mg | 0.592mg | 0% |
| Lysine | 0.113mg | 0.523mg | 0% |
| Methionine | 0.13mg | 0.11mg | 0% |
| Phenylalanine | 0.365mg | 0.451mg | 0% |
| Valine | 0.344mg | 0.368mg | 0% |
| Histidine | 0.162mg | 0.24mg | 0% |
| Fructose | 0.26g | 0% |
Macronutrient Comparison
Macronutrient breakdown side-by-side comparison
Protein:
6.06 g
Fats:
1.08 g
Carbs:
86.85 g
Water:
3.78 g
Other:
2.23 g
Protein:
7.73 g
Fats:
0.53 g
Carbs:
20.76 g
Water:
70.04 g
Other:
0.94 g
| Contains more FatsFats | +103.8% |
| Contains more CarbsCarbs | +318.4% |
| Contains more OtherOther | +137.2% |
| Contains more ProteinProtein | +27.6% |
| Contains more WaterWater | +1752.9% |
Fat Type Comparison
Fat type breakdown side-by-side comparison
Saturated fat:
Sat. Fat
0.26 g
Monounsaturated fat:
Mono. Fat
0.204 g
Polyunsaturated fat:
Poly. Fat
0.354 g
Saturated fat:
Sat. Fat
0.138 g
Monounsaturated fat:
Mono. Fat
0.044 g
Polyunsaturated fat:
Poly. Fat
0.225 g
| Contains more Mono. FatMonounsaturated fat | +363.6% |
| Contains more Poly. FatPolyunsaturated fat | +57.3% |
| Contains less Sat. FatSaturated fat | -46.9% |


