Summary of differences between cereal and soba Soba has less vitamin B1, vitamin B6, iron, vitamin B2, vitamin B3, zinc, vitamin A, vitamin C, and manganese than cereal. Cereal covers your daily need for vitamin B1, 516% more than soba. Soba has less sodium. The glycemic index of cereal is higher. These are the specific foods used in this comparison Cereals ready-to-eat, USDA Commodity Corn and Rice (includes all commodity brands) and Noodles, japanese, soba, cooked .
Infographic
Mineral Comparison
Mineral comparison score is based on the number of minerals by which one or the other food is richer. The "coverage" charts below show how much of the daily needs can be covered by 300 grams of the food.
9
100 g
300 g
1 cup - 29g 1 serving (NLEA serving = 1 cup) - 29g
Magnesium
Magnesium
Calcium
Calcium
Potassium
Potassium
Iron
Iron
Copper
Copper
Zinc
Zinc
Phosphorus
Phosphorus
Sodium
Sodium
Manganese
Manganese
Selenium
Selenium
14%
3%
9.3%
1277%
46%
207%
33%
104%
103%
34%
1
100 g
300 g
1 cup - 114g
Magnesium
Magnesium
Calcium
Calcium
Potassium
Potassium
Iron
Iron
Copper
Copper
Zinc
Zinc
Phosphorus
Phosphorus
Sodium
Sodium
Manganese
Manganese
Selenium
Selenium
6.4%
1.2%
3.1%
18%
2.7%
3.3%
11%
7.8%
49%
0%
Vitamin Comparison
Vitamin comparison score is based on the number of vitamins by which one or the other food is richer. The "coverage" charts below show how much of the daily needs can be covered by 300 grams of the food.
7
100 g
300 g
1 cup - 29g 1 serving (NLEA serving = 1 cup) - 29g
Vitamin C
Vit. C
Vitamin D
Vit. D
Vitamin A
Vit. A
Vitamin E
Vit. E
Vitamin B1
Vit. B1
Vitamin B2
Vit. B2
Vitamin B3
Vit. B3
Vitamin B5
Vit. B5
Vitamin B6
Vit. B6
Vitamin B12
Vit. B12
Vitamin K
Vit. K
Folate
Folate
128%
0%
271%
1.6%
1572%
893%
555%
14%
1381%
0%
0%
0%
1
100 g
300 g
1 cup - 114g
Vitamin C
Vit. C
Vitamin D
Vit. D
Vitamin A
Vit. A
Vitamin E
Vit. E
Vitamin B1
Vit. B1
Vitamin B2
Vit. B2
Vitamin B3
Vit. B3
Vitamin B5
Vit. B5
Vitamin B6
Vit. B6
Vitamin B12
Vit. B12
Vitamin K
Vit. K
Folate
Folate
0%
0%
0%
0%
24%
6%
9.6%
14%
9.2%
0%
0%
5.3%
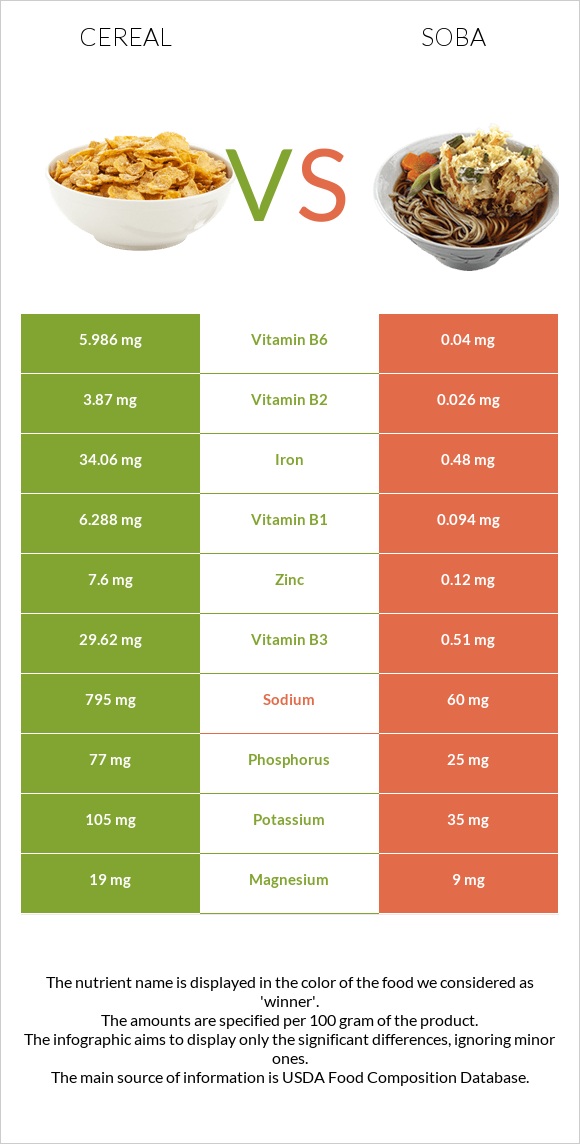
All nutrients comparison - raw data values
Nutrient
DV% diff.
Vitamin B1
6.288mg
0.094mg
516%
Vitamin B6
5.986mg
0.04mg
457%
Iron
34.06mg
0.48mg
420%
Vitamin B2
3.87mg
0.026mg
296%
Vitamin B3
29.62mg
0.51mg
182%
Vitamin A
814µg
0µg
90%
Zinc
7.6mg
0.12mg
68%
Vitamin C
38.5mg
0mg
43%
Sodium
795mg
60mg
32%
Carbs
86.85g
21.44g
22%
Manganese
0.79mg
0.374mg
18%
Calories
378kcal
99kcal
14%
Copper
0.137mg
0.008mg
14%
Selenium
6.3µg
11%
Phosphorus
77mg
25mg
7%
Fiber
1.4g
6%
Protein
6.06g
5.06g
2%
Fats
1.08g
0.1g
2%
Magnesium
19mg
9mg
2%
Potassium
105mg
35mg
2%
Folate
7µg
2%
Polyunsaturated fat
0.354g
0.031g
2%
Calcium
10mg
4mg
1%
Vitamin E
0.08mg
1%
Saturated fat
0.26g
0.019g
1%
Protein per 100 calories
1.6g
5.1g
N/A
Calories per 10 g protein
624kcal
196kcal
N/A
Weight per 100 calories
26g
101g
N/A
Net carbs
85.45g
21.44g
N/A
Sugar
10.35g
N/A
Vitamin B5
0.226mg
0.235mg
0%
Monounsaturated fat
0.204g
0.026g
0%
Tryptophan
0.066mg
0.072mg
0%
Threonine
0.241mg
0.177mg
0%
Isoleucine
0.26mg
0.195mg
0%
Leucine
0.767mg
0.33mg
0%
Lysine
0.113mg
0.214mg
0%
Methionine
0.13mg
0.072mg
0%
Phenylalanine
0.365mg
0.217mg
0%
Valine
0.344mg
0.249mg
0%
Histidine
0.162mg
0.119mg
0%
Fructose
0.26g
0%
Macronutrient Comparison
Macronutrient breakdown side-by-side comparison
4
6%
87%
4%
2%
Protein:
6.06 g
Fats:
1.08 g
Carbs:
86.85 g
Water:
3.78 g
Other:
2.23 g
1
5%
21%
73%
Protein:
5.06 g
Fats:
0.1 g
Carbs:
21.44 g
Water:
73.01 g
Other:
0.39 g
Contains
more
Protein Protein
+19.8%
Contains
more
Fats Fats
+980%
Contains
more
Carbs Carbs
+305.1%
Contains
more
Other Other
+471.8%
Contains
more
Water Water
+1831.5%
Fat Type Comparison
Fat type breakdown side-by-side comparison
2
32%
25%
43%
Saturated fat:
Sat. Fat
0.26 g
Monounsaturated fat:
Mono. Fat
0.204 g
Polyunsaturated fat:
Poly. Fat
0.354 g
1
25%
34%
41%
Saturated fat:
Sat. Fat
0.019 g
Monounsaturated fat:
Mono. Fat
0.026 g
Polyunsaturated fat:
Poly. Fat
0.031 g
Contains
more
Mono. Fat Monounsaturated fat
+684.6%
Contains
more
Poly. Fat Polyunsaturated fat
+1041.9%
Contains
less
Sat. Fat Saturated fat
-92.7%