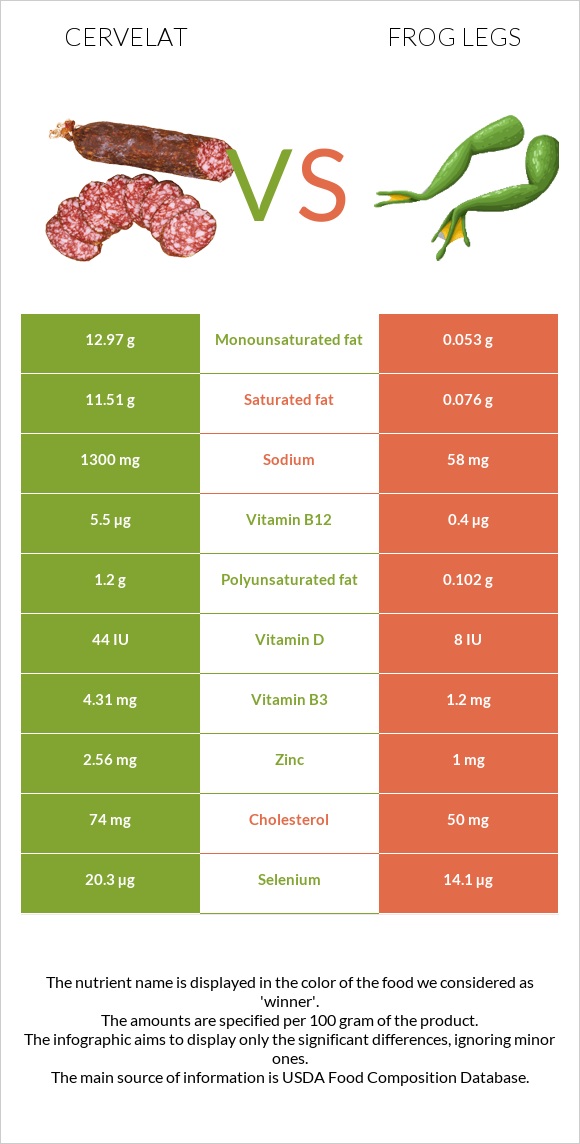
How are cervelat and frog legs different? Cervelat is richer in vitamin B12, vitamin B3, vitamin C, zinc, selenium, and vitamin B6, while frog legs are higher in copper. Cervelat covers your daily need for vitamin B12, 213% more than frog legs. Frog legs are lower in saturated fat. Cervelat has a higher glycemic index (28) than frog legs (0). Thuringer, cervelat, summer sausage, beef, pork and Frog legs, raw types were used in this article.
Infographic
Mineral Comparison
Mineral comparison score is based on the number of minerals by which one or the other food is richer. The "coverage" charts below show how much of the daily needs can be covered by 300 grams of the food.
3
100 g
300 g
2 oz 1 serving - 56g
Magnesium
Magnesium
Calcium
Calcium
Potassium
Potassium
Iron
Iron
Copper
Copper
Zinc
Zinc
Phosphorus
Phosphorus
Sodium
Sodium
Manganese
Manganese
Selenium
Selenium
10%
2.7%
23%
77%
50%
70%
48%
170%
0%
111%
5
100 g
300 g
1 leg - 45g
Magnesium
Magnesium
Calcium
Calcium
Potassium
Potassium
Iron
Iron
Copper
Copper
Zinc
Zinc
Phosphorus
Phosphorus
Sodium
Sodium
Manganese
Manganese
Selenium
Selenium
14%
5.4%
25%
56%
83%
27%
63%
7.6%
0%
77%
Vitamin Comparison
Vitamin comparison score is based on the number of vitamins by which one or the other food is richer. The "coverage" charts below show how much of the daily needs can be covered by 300 grams of the food.
7
100 g
300 g
2 oz 1 serving - 56g
Vitamin C
Vit. C
Vitamin D
Vit. D
Vitamin A
Vit. A
Vitamin E
Vit. E
Vitamin B1
Vit. B1
Vitamin B2
Vit. B2
Vitamin B3
Vit. B3
Vitamin B5
Vit. B5
Vitamin B6
Vit. B6
Vitamin B12
Vit. B12
Vitamin K
Vit. K
Folate
Folate
55%
17%
0%
4.4%
38%
76%
81%
0%
60%
688%
3.3%
1.5%
3
100 g
300 g
1 leg - 45g
Vitamin C
Vit. C
Vitamin D
Vit. D
Vitamin A
Vit. A
Vitamin E
Vit. E
Vitamin B1
Vit. B1
Vitamin B2
Vit. B2
Vitamin B3
Vit. B3
Vitamin B5
Vit. B5
Vitamin B6
Vit. B6
Vitamin B12
Vit. B12
Vitamin K
Vit. K
Folate
Folate
0%
3%
5%
20%
35%
58%
23%
0%
28%
50%
0.25%
11%
All nutrients comparison - raw data values
Nutrient
DV% diff.
Vitamin B12
5.5µg
0.4µg
213%
Sodium
1300mg
58mg
54%
Saturated fat
11.51g
0.076g
52%
Fats
30.43g
0.3g
46%
Monounsaturated fat
12.97g
0.053g
32%
Vitamin B3
4.31mg
1.2mg
19%
Vitamin C
16.6mg
0mg
18%
Calories
362kcal
73kcal
14%
Zinc
2.56mg
1mg
14%
Copper
0.15mg
0.25mg
11%
Selenium
20.3µg
14.1µg
11%
Vitamin B6
0.26mg
0.12mg
11%
Cholesterol
74mg
50mg
8%
Iron
2.04mg
1.5mg
7%
Polyunsaturated fat
1.2g
0.102g
7%
Vitamin B2
0.33mg
0.25mg
6%
Vitamin D*
44 IU
8 IU
5%
Vitamin D
1.1µg
0.2µg
5%
Phosphorus
111mg
147mg
5%
Vitamin E
0.22mg
1mg
5%
Folate
2µg
15µg
3%
Choline
78.9mg
65mg
3%
Protein
17.45g
16.4g
2%
Vitamin A
0µg
15µg
2%
Carbs
3.33g
0g
1%
Magnesium
14mg
20mg
1%
Calcium
9mg
18mg
1%
Potassium
260mg
285mg
1%
Vitamin B1
0.15mg
0.14mg
1%
Vitamin K
1.3µg
0.1µg
1%
Protein per 100 calories
4.8g
22g
N/A
Calories per 10 g protein
207kcal
45kcal
N/A
Weight per 100 calories
28g
137g
N/A
Unsaturated / Saturated Fat ratio
1.2
2
N/A
Net carbs
3.33g
0g
N/A
Sugar
0.85g
0g
N/A
Omega-3 - EPA
0g
0.014g
N/A
Omega-3 - DHA
0g
0.02g
N/A
Omega-3 - DPA
0g
0.007g
N/A
Macronutrient Comparison
Macronutrient breakdown side-by-side comparison
4
17%
30%
3%
45%
4%
Protein:
17.45 g
Fats:
30.43 g
Carbs:
3.33 g
Water:
45.18 g
Other:
3.61 g
1
16%
82%
Protein:
16.4 g
Fats:
0.3 g
Carbs:
0 g
Water:
81.9 g
Other:
1.4 g
Contains
more
Fats Fats
+10043.3%
Contains
more
Carbs Carbs
+∞%
Contains
more
Other Other
+157.9%
Contains
more
Water Water
+81.3%
Fat Type Comparison
Fat type breakdown side-by-side comparison
2
45%
51%
5%
Saturated fat:
Sat. Fat
11.51 g
Monounsaturated fat:
Mono. Fat
12.97 g
Polyunsaturated fat:
Poly. Fat
1.2 g
1
33%
23%
44%
Saturated fat:
Sat. Fat
0.076 g
Monounsaturated fat:
Mono. Fat
0.053 g
Polyunsaturated fat:
Poly. Fat
0.102 g
Contains
more
Mono. Fat Monounsaturated fat
+24371.7%
Contains
more
Poly. Fat Polyunsaturated fat
+1076.5%
Contains
less
Sat. Fat Saturated fat
-99.3%