Chanterelle vs. Maitake mushrooms — In-Depth Nutrition Comparison
Compare
Important differences between chanterelle and maitake mushrooms
- Chanterelle has more iron, vitamin B5, copper, manganese, and potassium; however, maitake mushrooms have more vitamin D*, vitamin B3, and vitamin B1.
- Maitake mushrooms' daily need coverage for vitamin D* is 114% more.
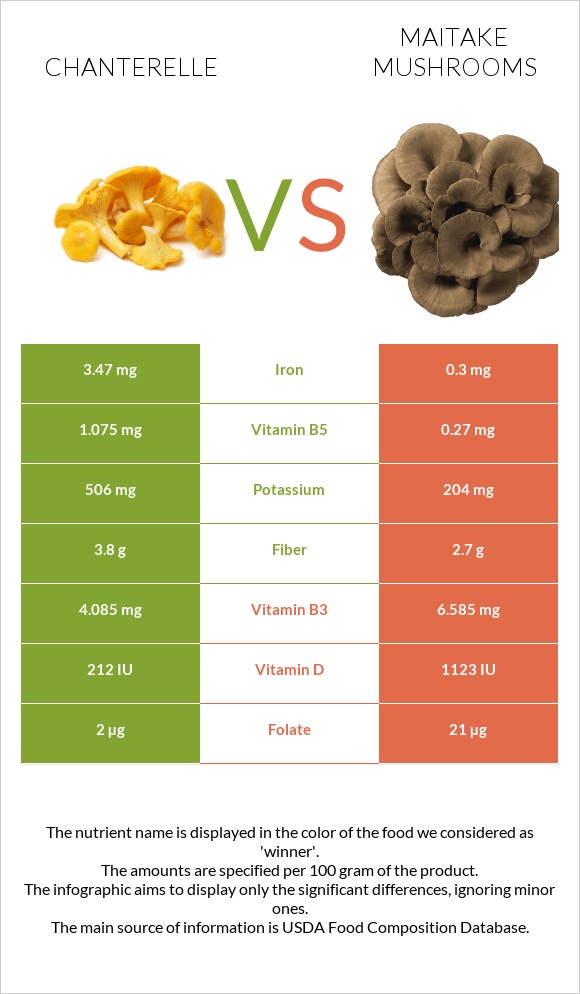
- Chanterelle has 12 times more iron than maitake mushrooms. Chanterelle has 3.47mg of iron, while maitake mushrooms have 0.3mg.
The food varieties used in the comparison are Mushrooms, Chanterelle, raw and Mushrooms, maitake, raw.
Infographic
Infographic link
Mineral Comparison
Mineral comparison score is based on the number of minerals by which one or the other food is richer. The "coverage" charts below show how much of the daily needs can be covered by 300 grams of the food.
| Contains more MagnesiumMagnesium | +30% |
| Contains more CalciumCalcium | +1400% |
| Contains more PotassiumPotassium | +148% |
| Contains more IronIron | +1056.7% |
| Contains more CopperCopper | +40.1% |
| Contains more ManganeseManganese | +384.7% |
| Contains more PhosphorusPhosphorus | +29.8% |
| Contains less SodiumSodium | -88.9% |
Vitamin Comparison
Vitamin comparison score is based on the number of vitamins by which one or the other food is richer. The "coverage" charts below show how much of the daily needs can be covered by 300 grams of the food.
| Contains more Vitamin B5Vitamin B5 | +298.1% |
| Contains more Vitamin DVitamin D | +430.2% |
| Contains more Vitamin B1Vitamin B1 | +873.3% |
| Contains more Vitamin B2Vitamin B2 | +12.6% |
| Contains more Vitamin B3Vitamin B3 | +61.2% |
| Contains more Vitamin B6Vitamin B6 | +27.3% |
| Contains more FolateFolate | +950% |
All nutrients comparison - raw data values
| Nutrient |  |
 |
DV% diff. |
| Vitamin D* | 212 IU | 1123 IU | 114% |
| Vitamin D | 5.3µg | 28.1µg | 114% |
| Iron | 3.47mg | 0.3mg | 40% |
| Vitamin B3 | 4.085mg | 6.585mg | 16% |
| Vitamin B5 | 1.075mg | 0.27mg | 16% |
| Copper | 0.353mg | 0.252mg | 11% |
| Vitamin B1 | 0.015mg | 0.146mg | 11% |
| Manganese | 0.286mg | 0.059mg | 10% |
| Potassium | 506mg | 204mg | 9% |
| Choline | 51.1mg | 9% | |
| Folate | 2µg | 21µg | 5% |
| Fiber | 3.8g | 2.7g | 4% |
| Phosphorus | 57mg | 74mg | 2% |
| Vitamin B2 | 0.215mg | 0.242mg | 2% |
| Protein | 1.49g | 1.94g | 1% |
| Fats | 0.53g | 0.19g | 1% |
| Magnesium | 13mg | 10mg | 1% |
| Calcium | 15mg | 1mg | 1% |
| Vitamin B6 | 0.044mg | 0.056mg | 1% |
| Polyunsaturated fat | 0.09g | 1% | |
| Calories | 38kcal | 31kcal | 0% |
| Protein per 100 calories | 3.9g | 6.3g | N/A |
| Calories per 10 g protein | 255kcal | 160kcal | N/A |
| Weight per 100 calories | 263g | 323g | N/A |
| Net carbs | 3.06g | 4.27g | N/A |
| Carbs | 6.86g | 6.97g | 0% |
| Sugar | 1.16g | 2.07g | N/A |
| Zinc | 0.71mg | 0.75mg | 0% |
| Sodium | 9mg | 1mg | 0% |
| Vitamin E | 0.01mg | 0% | |
| Selenium | 2.2µg | 2.2µg | 0% |
| Saturated fat | 0.03g | 0% | |
| Monounsaturated fat | 0.03g | 0% | |
| Tryptophan | 0.035mg | 0% | |
| Threonine | 0.095mg | 0% | |
| Isoleucine | 0.055mg | 0% | |
| Leucine | 0.08mg | 0% | |
| Lysine | 0.09mg | 0% | |
| Methionine | 0.015mg | 0% | |
| Phenylalanine | 0.06mg | 0% | |
| Valine | 0.1mg | 0% | |
| Histidine | 0.045mg | 0% |
Macronutrient Comparison
Macronutrient breakdown side-by-side comparison
Protein:
1.49 g
Fats:
0.53 g
Carbs:
6.86 g
Water:
89.85 g
Other:
1.27 g
Protein:
1.94 g
Fats:
0.19 g
Carbs:
6.97 g
Water:
90.37 g
Other:
0.53 g
| Contains more FatsFats | +178.9% |
| Contains more OtherOther | +139.6% |
| Contains more ProteinProtein | +30.2% |
~equal in
Carbs
~6.97g
~equal in
Water
~90.37g
Carbohydrate type comparison
Carbohydrate type breakdown side-by-side comparison
Starch:
0 g
Sucrose:
0 g
Glucose:
1.16 g
Fructose:
0 g
Lactose:
0 g
Maltose:
0 g
Galactose:
0 g
Starch:
0 g
Sucrose:
0 g
Glucose:
1.74 g
Fructose:
0 g
Lactose:
0.33 g
Maltose:
0 g
Galactose:
0 g
| Contains more GlucoseGlucose | +50% |
| Contains more LactoseLactose | +∞% |
~equal in
Starch
~0g
~equal in
Sucrose
~0g
~equal in
Fructose
~0g
~equal in
Maltose
~0g
~equal in
Galactose
~0g


