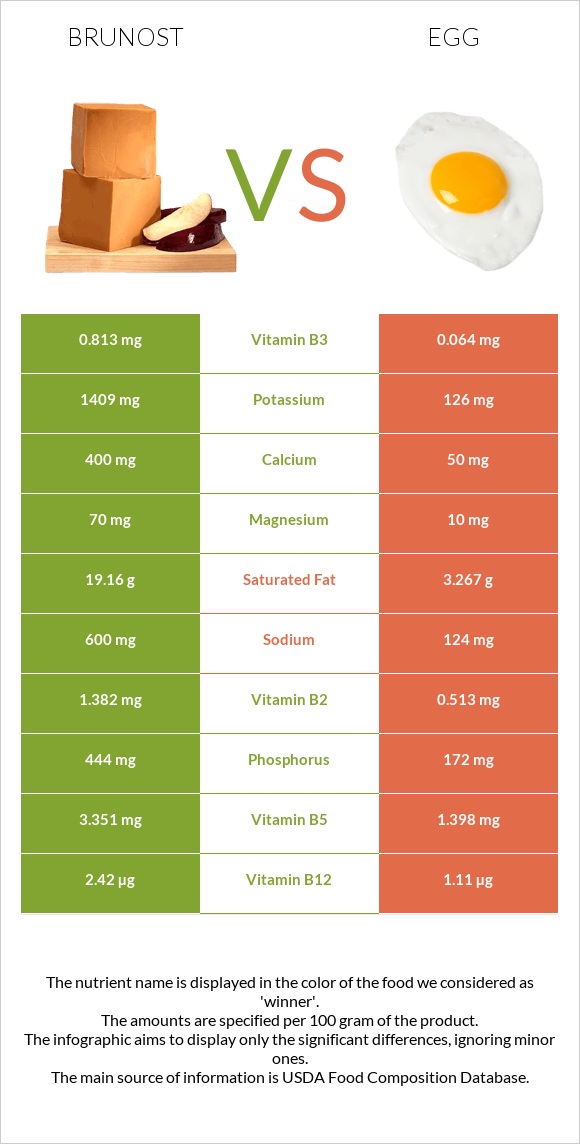
Significant differences between brunost and eggs Brunost has more vitamin B2, vitamin B12, vitamin B5, phosphorus, potassium, and calcium; however, eggs are richer in copper and selenium. Eggs cover your daily copper needs 213% more than brunost. Eggs have 11 times less potassium than brunost. Brunost has 1409mg of potassium, while eggs have 126mg. Eggs contain less saturated fat. Brunost has a higher glycemic index. The glycemic index of brunost is 27, while the glycemic index of eggs is 0. Specific food types used in this comparison are Cheese, gjetost and Egg, whole, cooked, hard-boiled .
Infographic
Mineral Comparison
Mineral comparison score is based on the number of minerals by which one or the other food is richer. The "coverage" charts below show how much of the daily needs can be covered by 300 grams of the food.
5
100 g
300 g
1 oz - 28.35g 1 package (8 oz) - 227g
Magnesium
Magnesium
Calcium
Calcium
Potassium
Potassium
Iron
Iron
Copper
Copper
Zinc
Zinc
Phosphorus
Phosphorus
Sodium
Sodium
Manganese
Manganese
Selenium
Selenium
50%
120%
124%
20%
27%
31%
190%
78%
5.2%
79%
4
100 g
300 g
1 tbsp - 8.5g 1 large - 50g 1 cup, chopped - 136g
Magnesium
Magnesium
Calcium
Calcium
Potassium
Potassium
Iron
Iron
Copper
Copper
Zinc
Zinc
Phosphorus
Phosphorus
Sodium
Sodium
Manganese
Manganese
Selenium
Selenium
7.1%
15%
11%
45%
667%
29%
74%
16%
3.4%
168%
Vitamin Comparison
Vitamin comparison score is based on the number of vitamins by which one or the other food is richer. The "coverage" charts below show how much of the daily needs can be covered by 300 grams of the food.
7
100 g
300 g
1 oz - 28.35g 1 package (8 oz) - 227g
Vitamin C
Vit. C
Vitamin D
Vit. D
Vitamin A
Vit. A
Vitamin E
Vit. E
Vitamin B1
Vit. B1
Vitamin B2
Vit. B2
Vitamin B3
Vit. B3
Vitamin B5
Vit. B5
Vitamin B6
Vit. B6
Vitamin B12
Vit. B12
Vitamin K
Vit. K
Folate
Folate
0%
0%
111%
0%
79%
319%
15%
201%
63%
303%
0%
3.8%
4
100 g
300 g
1 tbsp - 8.5g 1 large - 50g 1 cup, chopped - 136g
Vitamin C
Vit. C
Vitamin D
Vit. D
Vitamin A
Vit. A
Vitamin E
Vit. E
Vitamin B1
Vit. B1
Vitamin B2
Vit. B2
Vitamin B3
Vit. B3
Vitamin B5
Vit. B5
Vitamin B6
Vit. B6
Vitamin B12
Vit. B12
Vitamin K
Vit. K
Folate
Folate
0%
33%
50%
21%
17%
118%
1.2%
84%
28%
139%
0.75%
33%
All nutrients comparison - raw data values
Nutrient
DV% diff.
Copper
0.08mg
2mg
213%
Cholesterol
94mg
373mg
93%
Saturated fat
19.16g
3.267g
72%
Vitamin B2
1.382mg
0.513mg
67%
Vitamin B12
2.42µg
1.11µg
55%
Choline
293.8mg
53%
Phosphorus
444mg
172mg
39%
Vitamin B5
3.351mg
1.398mg
39%
Potassium
1409mg
126mg
38%
Calcium
400mg
50mg
35%
Selenium
14.5µg
30.8µg
30%
Fats
29.51g
10.61g
29%
Sodium
600mg
124mg
21%
Vitamin A
334µg
149µg
21%
Vitamin B1
0.315mg
0.066mg
21%
Calories
466kcal
155kcal
16%
Carbs
42.65g
1.12g
14%
Magnesium
70mg
10mg
14%
Vitamin B6
0.271mg
0.121mg
12%
Vitamin D*
87 IU
11%
Vitamin D
2.2µg
11%
Folate
5µg
44µg
10%
Monounsaturated fat
7.879g
4.077g
10%
Iron
0.52mg
1.19mg
8%
Vitamin E
1.03mg
7%
Protein
9.65g
12.58g
6%
Vitamin B3
0.813mg
0.064mg
5%
Polyunsaturated fat
0.938g
1.414g
3%
Zinc
1.14mg
1.05mg
1%
Manganese
0.04mg
0.026mg
1%
Protein per 100 calories
2.1g
8.1g
N/A
Calories per 10 g protein
483kcal
123kcal
N/A
Weight per 100 calories
21g
65g
N/A
Unsaturated / Saturated Fat ratio
0.46
1.7
N/A
Net carbs
42.65g
1.12g
N/A
Sugar
1.12g
N/A
Vitamin K
0.3µg
0%
Tryptophan
0.135mg
0.153mg
0%
Threonine
0.393mg
0.604mg
0%
Isoleucine
0.519mg
0.686mg
0%
Leucine
0.992mg
1.075mg
0%
Lysine
0.814mg
0.904mg
0%
Methionine
0.318mg
0.392mg
0%
Phenylalanine
0.54mg
0.668mg
0%
Valine
0.765mg
0.767mg
0%
Histidine
0.293mg
0.298mg
0%
Omega-3 - EPA
0.005g
N/A
Omega-3 - DHA
0.038g
N/A
Macronutrient Comparison
Macronutrient breakdown side-by-side comparison
3
10%
30%
43%
13%
5%
Protein:
9.65 g
Fats:
29.51 g
Carbs:
42.65 g
Water:
13.44 g
Other:
4.75 g
2
13%
11%
75%
Protein:
12.58 g
Fats:
10.61 g
Carbs:
1.12 g
Water:
74.62 g
Other:
1.07 g
Contains
more
Fats Fats
+178.1%
Contains
more
Carbs Carbs
+3708%
Contains
more
Other Other
+343.9%
Contains
more
Protein Protein
+30.4%
Contains
more
Water Water
+455.2%
Fat Type Comparison
Fat type breakdown side-by-side comparison
1
68%
28%
3%
Saturated fat:
Sat. Fat
19.16 g
Monounsaturated fat:
Mono. Fat
7.879 g
Polyunsaturated fat:
Poly. Fat
0.938 g
2
37%
47%
16%
Saturated fat:
Sat. Fat
3.267 g
Monounsaturated fat:
Mono. Fat
4.077 g
Polyunsaturated fat:
Poly. Fat
1.414 g
Contains
more
Mono. Fat Monounsaturated fat
+93.3%
Contains
less
Sat. Fat Saturated fat
-82.9%
Contains
more
Poly. Fat Polyunsaturated fat
+50.7%