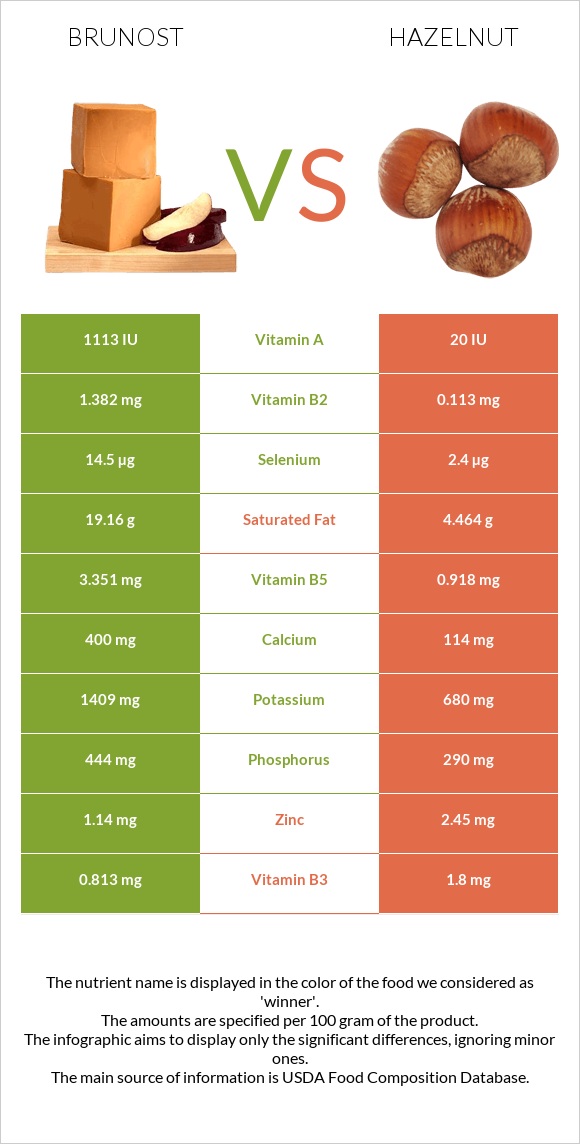
Differences between brunost and hazelnut Brunost is higher in vitamin B12, vitamin B2, vitamin B5, and calcium; however, hazelnut is richer in manganese, copper, iron, and fiber. Hazelnut's daily need coverage for manganese is 267% higher. Hazelnut has less cholesterol. Hazelnut has a lower glycemic index (15) than brunost (27). The food types used in this comparison are Cheese, gjetost and Nuts, hazelnuts or filberts .
Infographic
Mineral Comparison
Mineral comparison score is based on the number of minerals by which one or the other food is richer. The "coverage" charts below show how much of the daily needs can be covered by 300 grams of the food.
4
100 g
300 g
1 oz - 28.35g 1 package (8 oz) - 227g
Magnesium
Magnesium
Calcium
Calcium
Potassium
Potassium
Iron
Iron
Copper
Copper
Zinc
Zinc
Phosphorus
Phosphorus
Sodium
Sodium
Manganese
Manganese
Selenium
Selenium
50%
120%
124%
20%
27%
31%
190%
78%
5.2%
79%
6
100 g
300 g
10 nuts - 14g 1 oz (21 whole kernels) - 28.35g 1 cup, ground - 75g 1 cup, chopped - 115g 1 cup, whole - 135g
Magnesium
Magnesium
Calcium
Calcium
Potassium
Potassium
Iron
Iron
Copper
Copper
Zinc
Zinc
Phosphorus
Phosphorus
Sodium
Sodium
Manganese
Manganese
Selenium
Selenium
116%
34%
60%
176%
575%
67%
124%
0%
805%
13%
Vitamin Comparison
Vitamin comparison score is based on the number of vitamins by which one or the other food is richer. The "coverage" charts below show how much of the daily needs can be covered by 300 grams of the food.
4
100 g
300 g
1 oz - 28.35g 1 package (8 oz) - 227g
Vitamin C
Vit. C
Vitamin D
Vit. D
Vitamin A
Vit. A
Vitamin E
Vit. E
Vitamin B1
Vit. B1
Vitamin B2
Vit. B2
Vitamin B3
Vit. B3
Vitamin B5
Vit. B5
Vitamin B6
Vit. B6
Vitamin B12
Vit. B12
Vitamin K
Vit. K
Folate
Folate
0%
0%
111%
0%
79%
319%
15%
201%
63%
303%
0%
3.8%
7
100 g
300 g
10 nuts - 14g 1 oz (21 whole kernels) - 28.35g 1 cup, ground - 75g 1 cup, chopped - 115g 1 cup, whole - 135g
Vitamin C
Vit. C
Vitamin D
Vit. D
Vitamin A
Vit. A
Vitamin E
Vit. E
Vitamin B1
Vit. B1
Vitamin B2
Vit. B2
Vitamin B3
Vit. B3
Vitamin B5
Vit. B5
Vitamin B6
Vit. B6
Vitamin B12
Vit. B12
Vitamin K
Vit. K
Folate
Folate
21%
0%
0.33%
301%
161%
26%
34%
55%
130%
0%
36%
85%
All nutrients comparison - raw data values
Nutrient
DV% diff.
Manganese
0.04mg
6.175mg
267%
Copper
0.08mg
1.725mg
183%
Vitamin B12
2.42µg
0µg
101%
Vitamin E
15.03mg
100%
Vitamin B2
1.382mg
0.113mg
98%
Monounsaturated fat
7.879g
45.652g
94%
Saturated fat
19.16g
4.464g
67%
Iron
0.52mg
4.7mg
52%
Vitamin B5
3.351mg
0.918mg
49%
Fats
29.51g
60.75g
48%
Polyunsaturated fat
0.938g
7.92g
47%
Fiber
0g
9.7g
39%
Vitamin A
334µg
1µg
37%
Cholesterol
94mg
0mg
31%
Calcium
400mg
114mg
29%
Vitamin B1
0.315mg
0.643mg
27%
Folate
5µg
113µg
27%
Sodium
600mg
0mg
26%
Magnesium
70mg
163mg
22%
Phosphorus
444mg
290mg
22%
Selenium
14.5µg
2.4µg
22%
Vitamin B6
0.271mg
0.563mg
22%
Potassium
1409mg
680mg
21%
Zinc
1.14mg
2.45mg
12%
Vitamin K
14.2µg
12%
Protein
9.65g
14.95g
11%
Carbs
42.65g
16.7g
9%
Calories
466kcal
628kcal
8%
Choline
45.6mg
8%
Vitamin C
0mg
6.3mg
7%
Vitamin B3
0.813mg
1.8mg
6%
Protein per 100 calories
2.1g
2.4g
N/A
Calories per 10 g protein
483kcal
420kcal
N/A
Weight per 100 calories
21g
16g
N/A
Unsaturated / Saturated Fat ratio
0.46
12
N/A
Net carbs
42.65g
7g
N/A
Sugar
4.34g
N/A
Starch
0.48g
0%
Tryptophan
0.135mg
0.193mg
0%
Threonine
0.393mg
0.497mg
0%
Isoleucine
0.519mg
0.545mg
0%
Leucine
0.992mg
1.063mg
0%
Lysine
0.814mg
0.42mg
0%
Methionine
0.318mg
0.221mg
0%
Phenylalanine
0.54mg
0.663mg
0%
Valine
0.765mg
0.701mg
0%
Histidine
0.293mg
0.432mg
0%
Fructose
0.07g
0%
Macronutrient Comparison
Macronutrient breakdown side-by-side comparison
3
10%
30%
43%
13%
5%
Protein:
9.65 g
Fats:
29.51 g
Carbs:
42.65 g
Water:
13.44 g
Other:
4.75 g
2
15%
61%
17%
5%
2%
Protein:
14.95 g
Fats:
60.75 g
Carbs:
16.7 g
Water:
5.31 g
Other:
2.29 g
Contains
more
Carbs Carbs
+155.4%
Contains
more
Water Water
+153.1%
Contains
more
Other Other
+107.4%
Contains
more
Protein Protein
+54.9%
Contains
more
Fats Fats
+105.9%
Fat Type Comparison
Fat type breakdown side-by-side comparison
0
68%
28%
3%
Saturated fat:
Sat. Fat
19.16 g
Monounsaturated fat:
Mono. Fat
7.879 g
Polyunsaturated fat:
Poly. Fat
0.938 g
3
8%
79%
14%
Saturated fat:
Sat. Fat
4.464 g
Monounsaturated fat:
Mono. Fat
45.652 g
Polyunsaturated fat:
Poly. Fat
7.92 g
Contains
less
Sat. Fat Saturated fat
-76.7%
Contains
more
Mono. Fat Monounsaturated fat
+479.4%
Contains
more
Poly. Fat Polyunsaturated fat
+744.3%