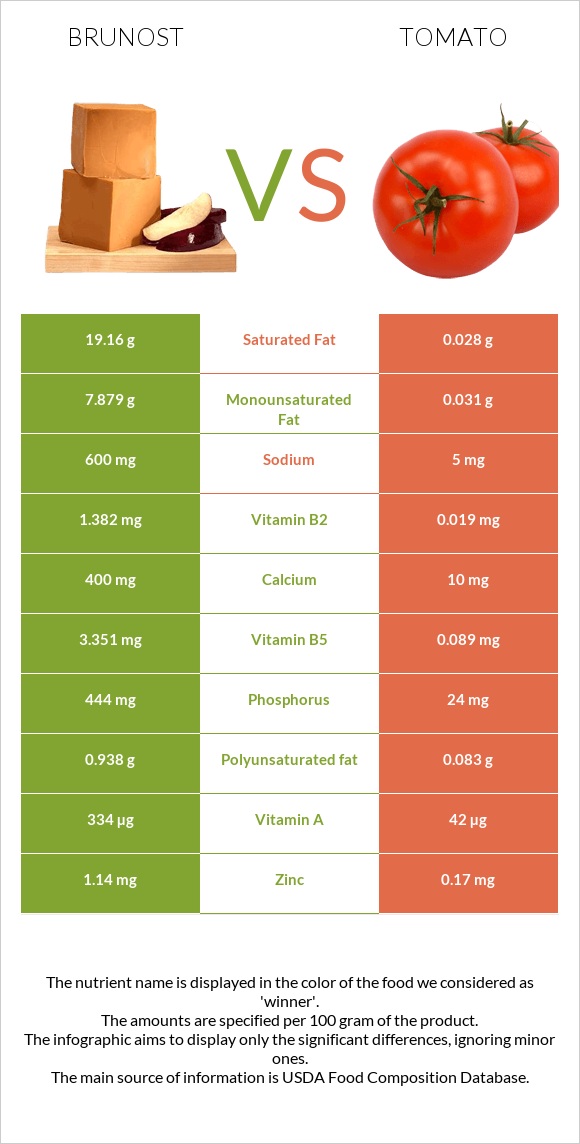
Significant differences between brunost and tomatoes The amount of vitamin B2, vitamin B12, vitamin B5, phosphorus, calcium, potassium, and selenium in brunost is higher than in tomatoes. Brunost covers your daily vitamin B2 needs 105% more than tomatoes. Tomatoes contain less cholesterol. Specific food types used in this comparison are Cheese, gjetost and Tomatoes, red, ripe, raw, year round average .
Infographic
Mineral Comparison
Mineral comparison score is based on the number of minerals by which one or the other food is richer. The "coverage" charts below show how much of the daily needs can be covered by 300 grams of the food.
8
100 g
300 g
1 oz - 28.35g 1 package (8 oz) - 227g
Magnesium
Magnesium
Calcium
Calcium
Potassium
Potassium
Iron
Iron
Copper
Copper
Zinc
Zinc
Phosphorus
Phosphorus
Sodium
Sodium
Manganese
Manganese
Selenium
Selenium
50%
120%
124%
20%
27%
31%
190%
78%
5.2%
79%
2
100 g
300 g
1 slice, thin/small - 15g 1 cherry - 17g 1 slice, medium (1/4" thick) - 20g 1 slice, thick/large (1/2" thick) - 27g 1 wedge (1/4 of medium tomato) - 31g 1 Italian tomato - 62g 1 plum tomato - 62g 1 small whole (2-2/5" dia) - 91g 1 medium whole (2-3/5" dia) - 123g 1 NLEA serving - 148g 1 cup cherry tomatoes - 149g 1 cup, chopped or sliced - 180g 1 large whole (3" dia) - 182g
Magnesium
Magnesium
Calcium
Calcium
Potassium
Potassium
Iron
Iron
Copper
Copper
Zinc
Zinc
Phosphorus
Phosphorus
Sodium
Sodium
Manganese
Manganese
Selenium
Selenium
7.9%
3%
21%
10%
20%
4.6%
10%
0.65%
15%
0%
Vitamin Comparison
Vitamin comparison score is based on the number of vitamins by which one or the other food is richer. The "coverage" charts below show how much of the daily needs can be covered by 300 grams of the food.
7
100 g
300 g
1 oz - 28.35g 1 package (8 oz) - 227g
Vitamin C
Vit. C
Vitamin D
Vit. D
Vitamin A
Vit. A
Vitamin E
Vit. E
Vitamin B1
Vit. B1
Vitamin B2
Vit. B2
Vitamin B3
Vit. B3
Vitamin B5
Vit. B5
Vitamin B6
Vit. B6
Vitamin B12
Vit. B12
Vitamin K
Vit. K
Folate
Folate
0%
0%
111%
0%
79%
319%
15%
201%
63%
303%
0%
3.8%
4
100 g
300 g
1 slice, thin/small - 15g 1 cherry - 17g 1 slice, medium (1/4" thick) - 20g 1 slice, thick/large (1/2" thick) - 27g 1 wedge (1/4 of medium tomato) - 31g 1 Italian tomato - 62g 1 plum tomato - 62g 1 small whole (2-2/5" dia) - 91g 1 medium whole (2-3/5" dia) - 123g 1 NLEA serving - 148g 1 cup cherry tomatoes - 149g 1 cup, chopped or sliced - 180g 1 large whole (3" dia) - 182g
Vitamin C
Vit. C
Vitamin D
Vit. D
Vitamin A
Vit. A
Vitamin E
Vit. E
Vitamin B1
Vit. B1
Vitamin B2
Vit. B2
Vitamin B3
Vit. B3
Vitamin B5
Vit. B5
Vitamin B6
Vit. B6
Vitamin B12
Vit. B12
Vitamin K
Vit. K
Folate
Folate
46%
0%
14%
11%
9.3%
4.4%
11%
5.3%
18%
0%
20%
11%
All nutrients comparison - raw data values
Nutrient
DV% diff.
Vitamin B2
1.382mg
0.019mg
105%
Vitamin B12
2.42µg
0µg
101%
Saturated fat
19.16g
0.028g
87%
Vitamin B5
3.351mg
0.089mg
65%
Phosphorus
444mg
24mg
60%
Fats
29.51g
0.2g
45%
Calcium
400mg
10mg
39%
Potassium
1409mg
237mg
34%
Vitamin A
334µg
42µg
32%
Cholesterol
94mg
0mg
31%
Sodium
600mg
5mg
26%
Selenium
14.5µg
0µg
26%
Vitamin B1
0.315mg
0.037mg
23%
Calories
466kcal
18kcal
22%
Monounsaturated fat
7.879g
0.031g
20%
Protein
9.65g
0.88g
18%
Vitamin C
0mg
13.7mg
15%
Vitamin B6
0.271mg
0.08mg
15%
Magnesium
70mg
11mg
14%
Carbs
42.65g
3.89g
13%
Zinc
1.14mg
0.17mg
9%
Vitamin K
7.9µg
7%
Polyunsaturated fat
0.938g
0.083g
6%
Fiber
0g
1.2g
5%
Vitamin E
0.54mg
4%
Iron
0.52mg
0.27mg
3%
Manganese
0.04mg
0.114mg
3%
Folate
5µg
15µg
3%
Copper
0.08mg
0.059mg
2%
Fructose
1.37g
2%
Vitamin B3
0.813mg
0.594mg
1%
Choline
6.7mg
1%
Protein per 100 calories
2.1g
4.9g
N/A
Calories per 10 g protein
483kcal
205kcal
N/A
Weight per 100 calories
21g
556g
N/A
Unsaturated / Saturated Fat ratio
0.46
4.1
N/A
Net carbs
42.65g
2.69g
N/A
Sugar
2.63g
N/A
Tryptophan
0.135mg
0.006mg
0%
Threonine
0.393mg
0.027mg
0%
Isoleucine
0.519mg
0.018mg
0%
Leucine
0.992mg
0.025mg
0%
Lysine
0.814mg
0.027mg
0%
Methionine
0.318mg
0.006mg
0%
Phenylalanine
0.54mg
0.027mg
0%
Valine
0.765mg
0.018mg
0%
Histidine
0.293mg
0.014mg
0%
Macronutrient Comparison
Macronutrient breakdown side-by-side comparison
4
10%
30%
43%
13%
5%
Protein:
9.65 g
Fats:
29.51 g
Carbs:
42.65 g
Water:
13.44 g
Other:
4.75 g
1
4%
95%
Protein:
0.88 g
Fats:
0.2 g
Carbs:
3.89 g
Water:
94.52 g
Other:
0.51 g
Contains
more
Protein Protein
+996.6%
Contains
more
Fats Fats
+14655%
Contains
more
Carbs Carbs
+996.4%
Contains
more
Other Other
+831.4%
Contains
more
Water Water
+603.3%
Fat Type Comparison
Fat type breakdown side-by-side comparison
2
68%
28%
3%
Saturated fat:
Sat. Fat
19.16 g
Monounsaturated fat:
Mono. Fat
7.879 g
Polyunsaturated fat:
Poly. Fat
0.938 g
1
20%
22%
58%
Saturated fat:
Sat. Fat
0.028 g
Monounsaturated fat:
Mono. Fat
0.031 g
Polyunsaturated fat:
Poly. Fat
0.083 g
Contains
more
Mono. Fat Monounsaturated fat
+25316.1%
Contains
more
Poly. Fat Polyunsaturated fat
+1030.1%
Contains
less
Sat. Fat Saturated fat
-99.9%