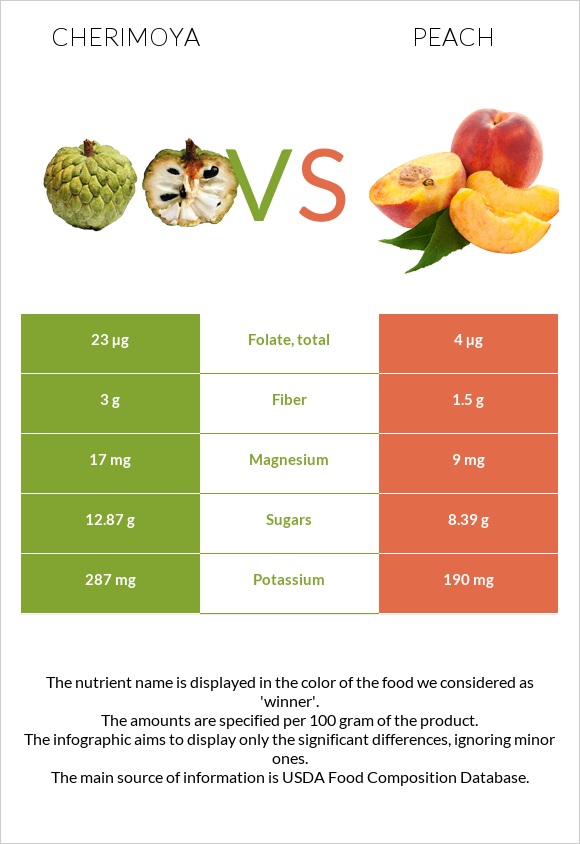
How are cherimoya and peach different? Cherimoya is richer in vitamin B6, vitamin B2, vitamin C, vitamin B1, and fiber, while peach is higher in vitamin A. Cherimoya covers your daily need for vitamin B6, 18% more than peach. Cherimoya contains 6 times more folate than peach. Cherimoya contains 23µg of folate, while peach contains 4µg. Peach is lower in sugar. Cherimoya has a higher glycemic index (59) than peach (42). Cherimoya, raw and Peaches, yellow, raw types were used in this article.
Infographic
Mineral Comparison
Mineral comparison score is based on the number of minerals by which one or the other food is richer. The "coverage" charts below show how much of the daily needs can be covered by 300 grams of the food.
5
100 g
300 g
1 cup, pieces - 160g 1 fruit without skin and seeds - 235g
Magnesium
Magnesium
Calcium
Calcium
Potassium
Potassium
Iron
Iron
Copper
Copper
Zinc
Zinc
Phosphorus
Phosphorus
Sodium
Sodium
Manganese
Manganese
Selenium
Selenium
12%
3%
25%
10%
23%
4.4%
11%
0.91%
12%
0%
2
100 g
300 g
1 small (2-1/2" dia) - 130g 1 NLEA serving - 147g 1 medium (2-2/3" dia) - 150g 1 cup slices - 154g 1 large (2-3/4" dia) - 175g 1 extra large (3" dia) - 224g
Magnesium
Magnesium
Calcium
Calcium
Potassium
Potassium
Iron
Iron
Copper
Copper
Zinc
Zinc
Phosphorus
Phosphorus
Sodium
Sodium
Manganese
Manganese
Selenium
Selenium
6.4%
1.8%
17%
9.4%
23%
4.6%
8.6%
0%
8%
0.55%
Vitamin Comparison
Vitamin comparison score is based on the number of vitamins by which one or the other food is richer. The "coverage" charts below show how much of the daily needs can be covered by 300 grams of the food.
6
100 g
300 g
1 cup, pieces - 160g 1 fruit without skin and seeds - 235g
Vitamin C
Vit. C
Vitamin D
Vit. D
Vitamin A
Vit. A
Vitamin E
Vit. E
Vitamin B1
Vit. B1
Vitamin B2
Vit. B2
Vitamin B3
Vit. B3
Vitamin B5
Vit. B5
Vitamin B6
Vit. B6
Vitamin B12
Vit. B12
Vitamin K
Vit. K
Folate
Folate
42%
0%
0%
5.4%
25%
30%
12%
21%
59%
0%
0%
17%
4
100 g
300 g
1 small (2-1/2" dia) - 130g 1 NLEA serving - 147g 1 medium (2-2/3" dia) - 150g 1 cup slices - 154g 1 large (2-3/4" dia) - 175g 1 extra large (3" dia) - 224g
Vitamin C
Vit. C
Vitamin D
Vit. D
Vitamin A
Vit. A
Vitamin E
Vit. E
Vitamin B1
Vit. B1
Vitamin B2
Vit. B2
Vitamin B3
Vit. B3
Vitamin B5
Vit. B5
Vitamin B6
Vit. B6
Vitamin B12
Vit. B12
Vitamin K
Vit. K
Folate
Folate
22%
0%
5.3%
15%
6%
7.2%
15%
9.2%
5.8%
0%
6.5%
3%
All nutrients comparison - raw data values
Nutrient
DV% diff.
Vitamin B6
0.257mg
0.025mg
18%
Vitamin B2
0.131mg
0.031mg
8%
Vitamin C
12.6mg
6.6mg
7%
Fiber
3g
1.5g
6%
Vitamin B1
0.101mg
0.024mg
6%
Fructose
6.28g
1.53g
6%
Folate
23µg
4µg
5%
Vitamin B5
0.345mg
0.153mg
4%
Carbs
17.71g
9.54g
3%
Potassium
287mg
190mg
3%
Vitamin E
0.27mg
0.73mg
3%
Calories
75kcal
39kcal
2%
Magnesium
17mg
9mg
2%
Vitamin A
0µg
16µg
2%
Vitamin K
2.6µg
2%
Protein
1.57g
0.91g
1%
Fats
0.68g
0.25g
1%
Phosphorus
26mg
20mg
1%
Manganese
0.093mg
0.061mg
1%
Vitamin B3
0.644mg
0.806mg
1%
Choline
6.1mg
1%
Saturated fat
0.233g
0.019g
1%
Polyunsaturated fat
0.188g
0.086g
1%
Protein per 100 calories
2.1g
2.3g
N/A
Calories per 10 g protein
478kcal
429kcal
N/A
Weight per 100 calories
133g
256g
N/A
Net carbs
14.71g
8.04g
N/A
Calcium
10mg
6mg
0%
Iron
0.27mg
0.25mg
0%
Sugar
12.87g
8.39g
N/A
Copper
0.069mg
0.068mg
0%
Zinc
0.16mg
0.17mg
0%
Sodium
7mg
0mg
0%
Selenium
0.1µg
0%
Monounsaturated fat
0.055g
0.067g
0%
Tryptophan
0.031mg
0.01mg
0%
Threonine
0.052mg
0.016mg
0%
Isoleucine
0.042mg
0.017mg
0%
Leucine
0.063mg
0.027mg
0%
Lysine
0.042mg
0.03mg
0%
Methionine
0.021mg
0.01mg
0%
Phenylalanine
0.042mg
0.019mg
0%
Valine
0.063mg
0.022mg
0%
Histidine
0.021mg
0.013mg
0%
Omega-3 - ALA
0.159g
N/A
Omega-6 - Linoleic acid
0.028g
N/A
Macronutrient Comparison
Macronutrient breakdown side-by-side comparison
4
18%
79%
Protein:
1.57 g
Fats:
0.68 g
Carbs:
17.71 g
Water:
79.39 g
Other:
0.65 g
1
10%
89%
Protein:
0.91 g
Fats:
0.25 g
Carbs:
9.54 g
Water:
88.87 g
Other:
0.43 g
Contains
more
Protein Protein
+72.5%
Contains
more
Fats Fats
+172%
Contains
more
Carbs Carbs
+85.6%
Contains
more
Other Other
+51.2%
Contains
more
Water Water
+11.9%
Fat Type Comparison
Fat type breakdown side-by-side comparison
1
49%
12%
39%
Saturated fat:
Sat. Fat
0.233 g
Monounsaturated fat:
Mono. Fat
0.055 g
Polyunsaturated fat:
Poly. Fat
0.188 g
2
11%
39%
50%
Saturated fat:
Sat. Fat
0.019 g
Monounsaturated fat:
Mono. Fat
0.067 g
Polyunsaturated fat:
Poly. Fat
0.086 g
Contains
more
Poly. Fat Polyunsaturated fat
+118.6%
Contains
less
Sat. Fat Saturated fat
-91.8%
Contains
more
Mono. Fat Monounsaturated fat
+21.8%
Carbohydrate type comparison
Carbohydrate type breakdown side-by-side comparison
2
5%
46%
49%
Starch:
0 g
Sucrose:
0.66 g
Glucose:
5.93 g
Fructose:
6.28 g
Lactose:
0 g
Maltose:
0 g
Galactose:
0 g
3
57%
23%
18%
Starch:
0 g
Sucrose:
4.76 g
Glucose:
1.95 g
Fructose:
1.53 g
Lactose:
0 g
Maltose:
0.08 g
Galactose:
0.06 g
Contains
more
Glucose Glucose
+204.1%
Contains
more
Fructose Fructose
+310.5%
Contains
more
Sucrose Sucrose
+621.2%
Contains
more
Maltose Maltose
+∞%
Contains
more
Galactose Galactose
+∞%
~equal in
Starch
~0g
~equal in
Lactose
~0g