How are cherries and persimmon different? Persimmon is higher than cherries in vitamin C and iron. Persimmon covers your daily need for vitamin C, 62% more than cherries. Persimmon has a higher glycemic index (61) than cherries (22). Cherries, sour, red, raw and Persimmons, native, raw types were used in this article.
Infographic
Mineral Comparison
Mineral comparison score is based on the number of minerals by which one or the other food is richer. The "coverage" charts below show how much of the daily needs can be covered by 300 grams of the food.
4
100 g
300 g
1 cup, with pits, yields - 103g 1 cup, without pits - 155g
Magnesium
Magnesium
Calcium
Calcium
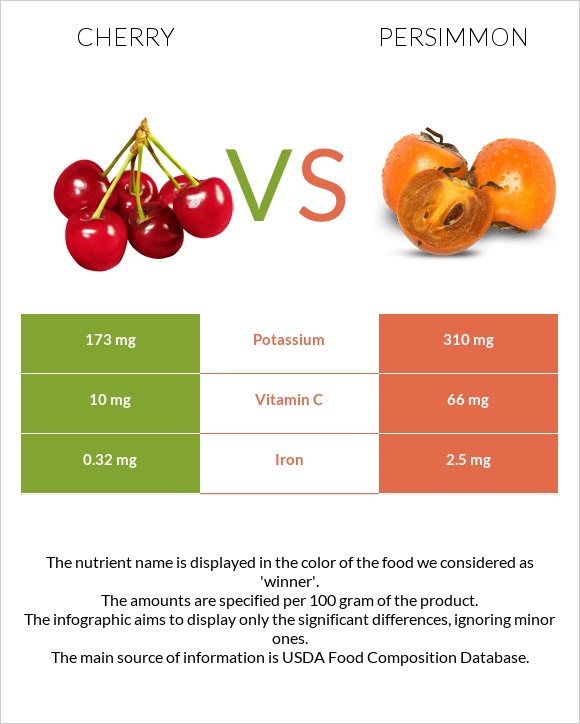
Potassium
Potassium
Iron
Iron
Copper
Copper
Zinc
Zinc
Phosphorus
Phosphorus
Sodium
Sodium
Manganese
Manganese
Selenium
Selenium
6.4%
4.8%
15%
12%
35%
2.7%
6.4%
0.39%
15%
0%
5
100 g
300 g
1 fruit without refuse - 25g
Magnesium
Magnesium
Calcium
Calcium
Potassium
Potassium
Iron
Iron
Copper
Copper
Zinc
Zinc
Phosphorus
Phosphorus
Sodium
Sodium
Manganese
Manganese
Selenium
Selenium
0%
8.1%
27%
94%
0%
0%
11%
0.13%
0%
0%
Vitamin Comparison
Vitamin comparison score is based on the number of vitamins by which one or the other food is richer. The "coverage" charts below show how much of the daily needs can be covered by 300 grams of the food.
9
100 g
300 g
1 cup, with pits, yields - 103g 1 cup, without pits - 155g
Vitamin C
Vit. C
Vitamin D
Vit. D
Vitamin A
Vit. A
Vitamin E
Vit. E
Vitamin B1
Vit. B1
Vitamin B2
Vit. B2
Vitamin B3
Vit. B3
Vitamin B5
Vit. B5
Vitamin B6
Vit. B6
Vitamin B12
Vit. B12
Vitamin K
Vit. K
Folate
Folate
33%
0%
21%
1.4%
7.5%
9.2%
7.5%
8.6%
10%
0%
5.3%
6%
1
100 g
300 g
1 fruit without refuse - 25g
Vitamin C
Vit. C
Vitamin D
Vit. D
Vitamin A
Vit. A
Vitamin E
Vit. E
Vitamin B1
Vit. B1
Vitamin B2
Vit. B2
Vitamin B3
Vit. B3
Vitamin B5
Vit. B5
Vitamin B6
Vit. B6
Vitamin B12
Vit. B12
Vitamin K
Vit. K
Folate
Folate
220%
0%
0%
0%
0%
0%
0%
0%
0%
0%
0%
0%
All nutrients comparison - raw data values
Nutrient
DV% diff.
Vitamin C
10mg
66mg
62%
Iron
0.32mg
2.5mg
27%
Copper
0.104mg
12%
Carbs
12.18g
33.5g
7%
Vitamin A
64µg
7%
Fiber
1.6g
6%
Manganese
0.112mg
5%
Calories
50kcal
127kcal
4%
Potassium
173mg
310mg
4%
Fructose
3.51g
4%
Vitamin B1
0.03mg
3%
Vitamin B2
0.04mg
3%
Vitamin B3
0.4mg
3%
Vitamin B5
0.143mg
3%
Vitamin B6
0.044mg
3%
Magnesium
9mg
2%
Phosphorus
15mg
26mg
2%
Vitamin K
2.1µg
2%
Folate
8µg
2%
Calcium
16mg
27mg
1%
Zinc
0.1mg
1%
Choline
6.1mg
1%
Polyunsaturated fat
0.09g
1%
Protein
1g
0.8g
0%
Protein per 100 calories
2g
0.63g
N/A
Calories per 10 g protein
500kcal
1588kcal
N/A
Weight per 100 calories
200g
79g
N/A
Fats
0.3g
0.4g
0%
Net carbs
10.58g
33.5g
N/A
Sugar
8.49g
N/A
Sodium
3mg
1mg
0%
Vitamin E
0.07mg
0%
Saturated fat
0.068g
0%
Monounsaturated fat
0.082g
0%
Tryptophan
0.014mg
0%
Threonine
0.041mg
0%
Isoleucine
0.035mg
0%
Leucine
0.058mg
0%
Lysine
0.045mg
0%
Methionine
0.007mg
0%
Phenylalanine
0.036mg
0%
Valine
0.042mg
0%
Histidine
0.016mg
0%
Macronutrient Comparison
Macronutrient breakdown side-by-side comparison
2
12%
86%
Protein:
1 g
Fats:
0.3 g
Carbs:
12.18 g
Water:
86.13 g
Other:
0.39 g
3
34%
64%
Protein:
0.8 g
Fats:
0.4 g
Carbs:
33.5 g
Water:
64.4 g
Other:
0.9 g
Contains
more
Protein Protein
+25%
Contains
more
Water Water
+33.7%
Contains
more
Fats Fats
+33.3%
Contains
more
Carbs Carbs
+175%
Contains
more
Other Other
+130.8%