Chinese cuisine vs. Cream of Wheat — In-Depth Nutrition Comparison
Compare
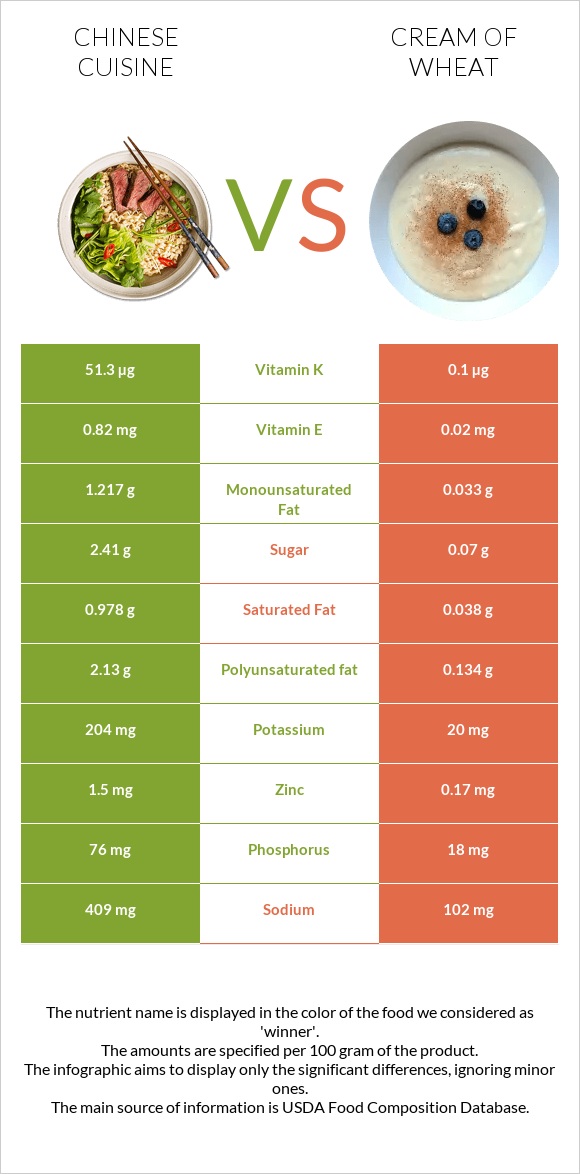
Significant differences between chinese cuisine and cream of Wheat
- Chinese cuisine has more vitamin K, vitamin B12, vitamin C, and zinc; however, cream of Wheat is richer in iron, vitamin B1, vitamin B2, vitamin B6, and vitamin B3.
- Cream of Wheat covers your daily iron needs 48% more than chinese cuisine.
- Cream of Wheat contains less sodium.
Specific food types used in this comparison are Restaurant, Chinese, beef, and vegetables and Cereals, CREAM OF WHEAT, instant, prepared with water, without salt.
Infographic
Infographic link
Mineral Comparison
Mineral comparison score is based on the number of minerals by which one or the other food is richer. The "coverage" charts below show how much of the daily needs can be covered by 300 grams of the food.
| Contains more MagnesiumMagnesium | +150% |
| Contains more PotassiumPotassium | +920% |
| Contains more CopperCopper | +14% |
| Contains more ZincZinc | +782.4% |
| Contains more PhosphorusPhosphorus | +322.2% |
| Contains more ManganeseManganese | +∞% |
| Contains more SeleniumSelenium | +91.4% |
| Contains more CalciumCalcium | +190.9% |
| Contains more IronIron | +346.8% |
| Contains less SodiumSodium | -75.1% |
Vitamin Comparison
Vitamin comparison score is based on the number of vitamins by which one or the other food is richer. The "coverage" charts below show how much of the daily needs can be covered by 300 grams of the food.
| Contains more Vitamin CVitamin C | +∞% |
| Contains more Vitamin EVitamin E | +4000% |
| Contains more Vitamin DVitamin D | +∞% |
| Contains more Vitamin B5Vitamin B5 | +440.2% |
| Contains more Vitamin B12Vitamin B12 | +∞% |
| Contains more Vitamin KVitamin K | +51200% |
| Contains more Vitamin AVitamin A | +268.3% |
| Contains more Vitamin B1Vitamin B1 | +603% |
| Contains more Vitamin B2Vitamin B2 | +281.8% |
| Contains more Vitamin B3Vitamin B3 | +134.3% |
| Contains more Vitamin B6Vitamin B6 | +91.9% |
| Contains more FolateFolate | +37.8% |
All nutrients comparison - raw data values
| Nutrient |  |
 |
DV% diff. |
| Iron | 1.11mg | 4.96mg | 48% |
| Vitamin K | 51.3µg | 0.1µg | 43% |
| Vitamin B12 | 0.48µg | 0µg | 20% |
| Vitamin A | 63µg | 232µg | 19% |
| Vitamin B1 | 0.033mg | 0.232mg | 17% |
| Vitamin C | 11.6mg | 0mg | 13% |
| Sodium | 409mg | 102mg | 13% |
| Polyunsaturated fat | 2.13g | 0.134g | 13% |
| Zinc | 1.5mg | 0.17mg | 12% |
| Vitamin B2 | 0.055mg | 0.21mg | 12% |
| Vitamin B3 | 1.32mg | 3.093mg | 11% |
| Vitamin B6 | 0.161mg | 0.309mg | 11% |
| Protein | 7.08g | 1.84g | 10% |
| Fats | 5.3g | 0.24g | 8% |
| Phosphorus | 76mg | 18mg | 8% |
| Vitamin B5 | 0.443mg | 0.082mg | 7% |
| Manganese | 0.147mg | 0mg | 6% |
| Selenium | 6.7µg | 3.5µg | 6% |
| Choline | 34.5mg | 6% | |
| Cholesterol | 14mg | 0mg | 5% |
| Potassium | 204mg | 20mg | 5% |
| Vitamin E | 0.82mg | 0.02mg | 5% |
| Calcium | 22mg | 64mg | 4% |
| Fiber | 1.5g | 0.6g | 4% |
| Folate | 45µg | 62µg | 4% |
| Saturated fat | 0.978g | 0.038g | 4% |
| Monounsaturated fat | 1.217g | 0.033g | 3% |
| Calories | 105kcal | 62kcal | 2% |
| Carbs | 7.29g | 13.08g | 2% |
| Magnesium | 15mg | 6mg | 2% |
| Copper | 0.049mg | 0.043mg | 1% |
| Starch | 1.82g | 1% | |
| Vitamin D | 0.1µg | 1% | |
| Fructose | 0.55g | 1% | |
| Net carbs | 5.79g | 12.48g | N/A |
| Vitamin D | 3 IU | 0% | |
| Sugar | 2.41g | 0.07g | N/A |
| Trans fat | 0.058g | N/A | |
| Tryptophan | 0.083mg | 0.025mg | 0% |
| Threonine | 0.313mg | 0.058mg | 0% |
| Isoleucine | 0.314mg | 0.08mg | 0% |
| Leucine | 0.525mg | 0.139mg | 0% |
| Lysine | 0.552mg | 0.047mg | 0% |
| Methionine | 0.158mg | 0.034mg | 0% |
| Phenylalanine | 0.317mg | 0.099mg | 0% |
| Valine | 0.327mg | 0.089mg | 0% |
| Histidine | 0.207mg | 0.042mg | 0% |
| Omega-3 - EPA | 0.004g | 0g | N/A |
| Omega-3 - DHA | 0.001g | 0g | N/A |
| Omega-3 - ALA | 0.264g | N/A | |
| Omega-3 - DPA | 0.005g | 0g | N/A |
| Omega-6 - Gamma-linoleic acid | 0.001g | N/A | |
| Omega-6 - Dihomo-gamma-linoleic acid | 0.004g | N/A | |
| Omega-6 - Eicosadienoic acid | 0.002g | N/A | |
| Omega-6 - Linoleic acid | 1.803g | N/A |
Macronutrient Comparison
Macronutrient breakdown side-by-side comparison
Protein:
7.08 g
Fats:
5.3 g
Carbs:
7.29 g
Water:
78.82 g
Other:
1.51 g
Protein:
1.84 g
Fats:
0.24 g
Carbs:
13.08 g
Water:
84.4 g
Other:
0.44 g
| Contains more ProteinProtein | +284.8% |
| Contains more FatsFats | +2108.3% |
| Contains more OtherOther | +243.2% |
| Contains more CarbsCarbs | +79.4% |
~equal in
Water
~84.4g
Fat Type Comparison
Fat type breakdown side-by-side comparison
Saturated fat:
Sat. Fat
0.978 g
Monounsaturated fat:
Mono. Fat
1.217 g
Polyunsaturated fat:
Poly. Fat
2.13 g
Saturated fat:
Sat. Fat
0.038 g
Monounsaturated fat:
Mono. Fat
0.033 g
Polyunsaturated fat:
Poly. Fat
0.134 g
| Contains more Mono. FatMonounsaturated fat | +3587.9% |
| Contains more Poly. FatPolyunsaturated fat | +1489.6% |
| Contains less Sat. FatSaturated fat | -96.1% |
Carbohydrate type comparison
Carbohydrate type breakdown side-by-side comparison
Starch:
1.82 g
Sucrose:
1.17 g
Glucose:
0.69 g
Fructose:
0.55 g
Lactose:
0 g
Maltose:
0 g
Galactose:
0 g
Starch:
0 g
Sucrose:
0.07 g
Glucose:
0 g
Fructose:
0 g
Lactose:
0 g
Maltose:
0 g
Galactose:
0 g
| Contains more StarchStarch | +∞% |
| Contains more SucroseSucrose | +1571.4% |
| Contains more GlucoseGlucose | +∞% |
| Contains more FructoseFructose | +∞% |
~equal in
Lactose
~0g
~equal in
Maltose
~0g
~equal in
Galactose
~0g


