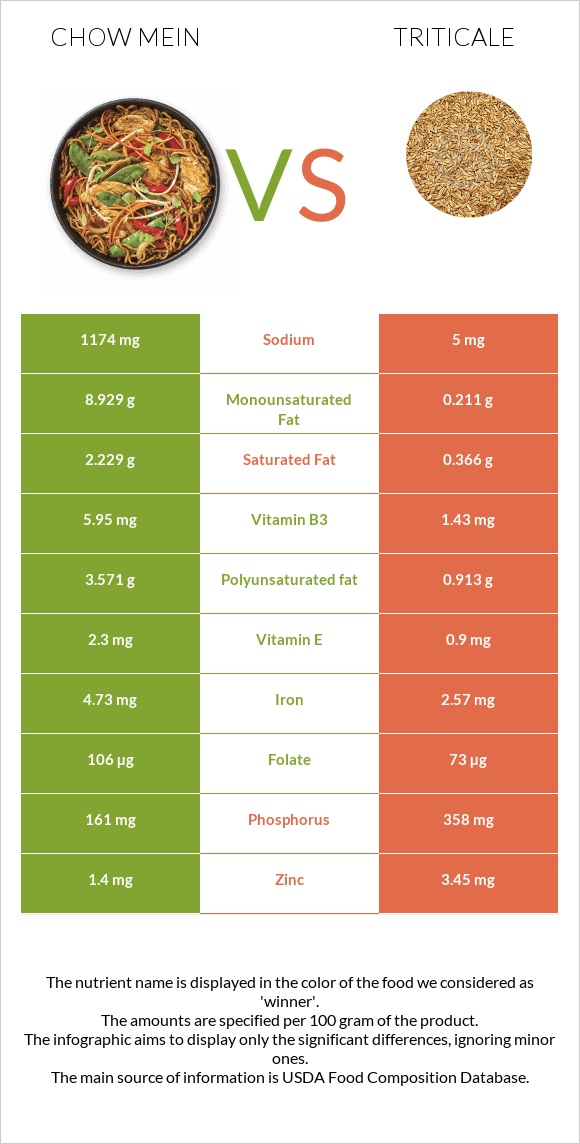
Important differences between chow mein and triticale Chow mein has more vitamin B3, iron, vitamin B2, and vitamin B1; however, triticale has more copper, phosphorus, zinc, magnesium, and vitamin B5. Chow mein's daily need coverage for sodium is 51% more. Chow mein has 4 times more vitamin B3 than triticale. Chow mein has 5.95mg of vitamin B3, while triticale has 1.43mg. Triticale is lower in sodium. Triticale has a higher glycemic index than chow mein. The food varieties used in the comparison are Noodles, chinese, chow mein and Triticale .
Infographic
Mineral Comparison
Mineral comparison score is based on the number of minerals by which one or the other food is richer. The "coverage" charts below show how much of the daily needs can be covered by 300 grams of the food.
2
100 g
300 g
0.5 cup dry - 28g 1.5 oz - 43g
Magnesium
Magnesium
Calcium
Calcium
Potassium
Potassium
Iron
Iron
Copper
Copper
Zinc
Zinc
Phosphorus
Phosphorus
Sodium
Sodium
Manganese
Manganese
Selenium
Selenium
37%
6%
11%
177%
56%
38%
69%
153%
0%
235%
8
100 g
300 g
1 cup - 192g
Magnesium
Magnesium
Calcium
Calcium
Potassium
Potassium
Iron
Iron
Copper
Copper
Zinc
Zinc
Phosphorus
Phosphorus
Sodium
Sodium
Manganese
Manganese
Selenium
Selenium
93%
11%
29%
96%
152%
94%
153%
0.65%
419%
0%
Vitamin Comparison
Vitamin comparison score is based on the number of vitamins by which one or the other food is richer. The "coverage" charts below show how much of the daily needs can be covered by 300 grams of the food.
6
100 g
300 g
0.5 cup dry - 28g 1.5 oz - 43g
Vitamin C
Vit. C
Vitamin D
Vit. D
Vitamin A
Vit. A
Vitamin E
Vit. E
Vitamin B1
Vit. B1
Vitamin B2
Vit. B2
Vitamin B3
Vit. B3
Vitamin B5
Vit. B5
Vitamin B6
Vit. B6
Vitamin B12
Vit. B12
Vitamin K
Vit. K
Folate
Folate
0%
0%
0%
46%
145%
97%
112%
32%
25%
0%
3.5%
80%
2
100 g
300 g
1 cup - 192g
Vitamin C
Vit. C
Vitamin D
Vit. D
Vitamin A
Vit. A
Vitamin E
Vit. E
Vitamin B1
Vit. B1
Vitamin B2
Vit. B2
Vitamin B3
Vit. B3
Vitamin B5
Vit. B5
Vitamin B6
Vit. B6
Vitamin B12
Vit. B12
Vitamin K
Vit. K
Folate
Folate
0%
0%
0%
18%
104%
31%
27%
79%
32%
0%
0%
55%
All nutrients comparison - raw data values
Nutrient
DV% diff.
Manganese
3.21mg
140%
Selenium
43µg
78%
Sodium
1174mg
5mg
51%
Copper
0.167mg
0.457mg
32%
Phosphorus
161mg
358mg
28%
Vitamin B3
5.95mg
1.43mg
28%
Iron
4.73mg
2.57mg
27%
Vitamin B2
0.421mg
0.134mg
22%
Monounsaturated fat
8.929g
0.211g
22%
Fats
15.43g
2.09g
21%
Magnesium
52mg
130mg
19%
Zinc
1.4mg
3.45mg
19%
Polyunsaturated fat
3.571g
0.913g
18%
Vitamin B5
0.533mg
1.323mg
16%
Fiber
3.7g
15%
Vitamin B1
0.578mg
0.416mg
14%
Protein
8.11g
13.05g
10%
Vitamin E
2.3mg
0.9mg
9%
Folate
106µg
73µg
8%
Saturated fat
2.229g
0.366g
8%
Calories
475kcal
336kcal
7%
Potassium
120mg
332mg
6%
Calcium
20mg
37mg
2%
Vitamin B6
0.11mg
0.138mg
2%
Choline
8.7mg
2%
Vitamin K
1.4µg
1%
Protein per 100 calories
1.7g
3.9g
N/A
Calories per 10 g protein
586kcal
257kcal
N/A
Weight per 100 calories
21g
30g
N/A
Unsaturated / Saturated Fat ratio
5.6
3.1
N/A
Net carbs
69.1g
72.13g
N/A
Carbs
72.8g
72.13g
0%
Sugar
5.71g
N/A
Trans fat
0.8g
N/A
Tryptophan
0.157mg
0%
Threonine
0.405mg
0%
Isoleucine
0.479mg
0%
Leucine
0.911mg
0%
Lysine
0.365mg
0%
Methionine
0.204mg
0%
Phenylalanine
0.638mg
0%
Valine
0.609mg
0%
Histidine
0.311mg
0%
Macronutrient Comparison
Macronutrient breakdown side-by-side comparison
3
8%
15%
73%
2%
Protein:
8.11 g
Fats:
15.43 g
Carbs:
72.8 g
Water:
1.18 g
Other:
2.48 g
2
13%
2%
72%
11%
2%
Protein:
13.05 g
Fats:
2.09 g
Carbs:
72.13 g
Water:
10.51 g
Other:
2.22 g
Contains
more
Fats Fats
+638.3%
Contains
more
Other Other
+11.7%
Contains
more
Protein Protein
+60.9%
Contains
more
Water Water
+790.7%
Fat Type Comparison
Fat type breakdown side-by-side comparison
2
15%
61%
24%
Saturated fat:
Sat. Fat
2.229 g
Monounsaturated fat:
Mono. Fat
8.929 g
Polyunsaturated fat:
Poly. Fat
3.571 g
1
25%
14%
61%
Saturated fat:
Sat. Fat
0.366 g
Monounsaturated fat:
Mono. Fat
0.211 g
Polyunsaturated fat:
Poly. Fat
0.913 g
Contains
more
Mono. Fat Monounsaturated fat
+4131.8%
Contains
more
Poly. Fat Polyunsaturated fat
+291.1%
Contains
less
Sat. Fat Saturated fat
-83.6%