Chuck steak vs. Ground turkey — In-Depth Nutrition Comparison
Compare
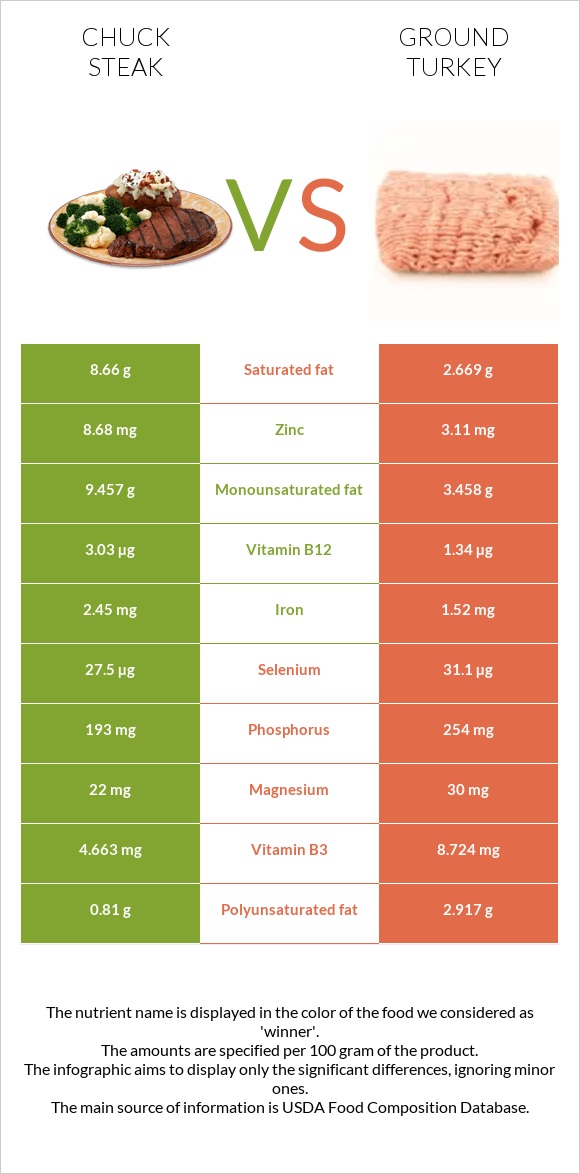
What are the main differences between chuck steak and ground turkey?
- Chuck steak is richer in vitamin B12, zinc, and iron, yet ground turkey is richer in vitamin B3, vitamin B6, vitamin B5, phosphorus, copper, and selenium.
- Chuck steak's daily need coverage for vitamin B12 is 70% higher.
- Chuck steak has 3 times more saturated fat than ground turkey. Chuck steak has 8.66g of saturated fat, while ground turkey has 2.669g.
We used Beef, chuck eye steak, boneless, separable lean, and fat, trimmed to 0" fat, all grades, cooked, grilled and Ground turkey, cooked types in this comparison.
Infographic
Infographic link
Mineral Comparison
Mineral comparison score is based on the number of minerals by which one or the other food is richer. The "coverage" charts below show how much of the daily needs can be covered by 300 grams of the food.
| Contains more MagnesiumMagnesium | +36.4% |
| Contains more CalciumCalcium | +75% |
| Contains more CopperCopper | +96.1% |
| Contains more PhosphorusPhosphorus | +31.6% |
| Contains more SeleniumSelenium | +13.1% |
Vitamin Comparison
Vitamin comparison score is based on the number of vitamins by which one or the other food is richer. The "coverage" charts below show how much of the daily needs can be covered by 300 grams of the food.
| Contains more Vitamin B12Vitamin B12 | +126.1% |
| Contains more Vitamin KVitamin K | +∞% |
| Contains more Vitamin AVitamin A | +242.9% |
| Contains more Vitamin DVitamin D | +100% |
| Contains more Vitamin B1Vitamin B1 | +16.7% |
| Contains more Vitamin B2Vitamin B2 | +10.5% |
| Contains more Vitamin B3Vitamin B3 | +87.1% |
| Contains more Vitamin B5Vitamin B5 | +58.6% |
| Contains more Vitamin B6Vitamin B6 | +69.7% |
| Contains more FolateFolate | +16.7% |
All nutrients comparison - raw data values
| Nutrient |  |
 |
DV% diff. |
| Vitamin B12 | 3.03µg | 1.34µg | 70% |
| Zinc | 8.68mg | 3.11mg | 51% |
| Saturated fat | 8.66g | 2.669g | 27% |
| Vitamin B3 | 4.663mg | 8.724mg | 25% |
| Vitamin B6 | 0.373mg | 0.633mg | 20% |
| Monounsaturated fat | 9.457g | 3.458g | 15% |
| Fats | 19.64g | 10.4g | 14% |
| Polyunsaturated fat | 0.81g | 2.917g | 14% |
| Iron | 2.45mg | 1.52mg | 12% |
| Phosphorus | 193mg | 254mg | 9% |
| Vitamin B5 | 0.752mg | 1.193mg | 9% |
| Copper | 0.077mg | 0.151mg | 8% |
| Selenium | 27.5µg | 31.1µg | 7% |
| Protein | 24.98g | 27.37g | 5% |
| Calories | 277kcal | 203kcal | 4% |
| Cholesterol | 87mg | 93mg | 2% |
| Magnesium | 22mg | 30mg | 2% |
| Vitamin A | 7µg | 24µg | 2% |
| Vitamin B2 | 0.191mg | 0.211mg | 2% |
| Calcium | 16mg | 28mg | 1% |
| Potassium | 325mg | 294mg | 1% |
| Vitamin D | 0.1µg | 0.2µg | 1% |
| Vitamin B1 | 0.066mg | 0.077mg | 1% |
| Vitamin K | 1.6µg | 0µg | 1% |
| Vitamin D | 5 IU | 8 IU | 0% |
| Sodium | 71mg | 78mg | 0% |
| Vitamin E | 0.1mg | 0.11mg | 0% |
| Manganese | 0.012mg | 0.011mg | 0% |
| Folate | 6µg | 7µg | 0% |
| Trans fat | 1.287g | 0.134g | N/A |
| Choline | 79mg | 78.2mg | 0% |
| Tryptophan | 0.281mg | 0.312mg | 0% |
| Threonine | 1.099mg | 1.258mg | 0% |
| Isoleucine | 1.062mg | 1.227mg | 0% |
| Leucine | 2.009mg | 2.262mg | 0% |
| Lysine | 2.184mg | 2.452mg | 0% |
| Methionine | 0.709mg | 0.806mg | 0% |
| Phenylalanine | 0.951mg | 1.068mg | 0% |
| Valine | 1.129mg | 1.27mg | 0% |
| Histidine | 0.809mg | 0.811mg | 0% |
| Omega-3 - EPA | 0.001g | 0.01g | N/A |
| Omega-3 - DHA | 0g | 0.009g | N/A |
| Omega-3 - ALA | 0.041g | 0.136g | N/A |
| Omega-3 - DPA | 0.004g | 0.012g | N/A |
| Omega-3 - Eicosatrienoic acid | 0.001g | N/A | |
| Omega-6 - Gamma-linoleic acid | 0.008g | N/A | |
| Omega-6 - Dihomo-gamma-linoleic acid | 0.011g | N/A | |
| Omega-6 - Eicosadienoic acid | 0.006g | 0.019g | N/A |
| Omega-6 - Linoleic acid | 0.619g | 2.508g | N/A |
Macronutrient Comparison
Macronutrient breakdown side-by-side comparison
Protein:
24.98 g
Fats:
19.64 g
Carbs:
0 g
Water:
55.22 g
Other:
0.16 g
Protein:
27.37 g
Fats:
10.4 g
Carbs:
0 g
Water:
62.07 g
Other:
0.16 g
| Contains more FatsFats | +88.8% |
| Contains more WaterWater | +12.4% |
~equal in
Protein
~27.37g
~equal in
Carbs
~0g
~equal in
Other
~0.16g
Fat Type Comparison
Fat type breakdown side-by-side comparison
Saturated fat:
Sat. Fat
8.66 g
Monounsaturated fat:
Mono. Fat
9.457 g
Polyunsaturated fat:
Poly. Fat
0.81 g
Saturated fat:
Sat. Fat
2.669 g
Monounsaturated fat:
Mono. Fat
3.458 g
Polyunsaturated fat:
Poly. Fat
2.917 g
| Contains more Mono. FatMonounsaturated fat | +173.5% |
| Contains less Sat. FatSaturated fat | -69.2% |
| Contains more Poly. FatPolyunsaturated fat | +260.1% |


