Chuck steak Nutrition & Calories - Complete data of all nutrients

Introduction
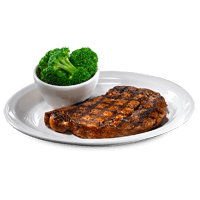
Chuck steak is a flavorful and relatively affordable cut of beef that comes from the shoulder of the cow. It contains a good balance of protein, fat, vitamins, and minerals. This article will discuss the nutritional and caloric values of chuck steak in detail.
What Is a Chuck Steak?
Chuck steak is a tough cut frequently baked at high temperatures to ensure that it cooks quickly and stays moist. However, it can also be slow-cooked - braised or stewed, to help break down the tough fibers and make the meat tender and flavorful. This steak is usually a rectangular 1-inch or 2.5cm thick cut with a rich flavor and moderate fat content.
Types of Chuck Steak
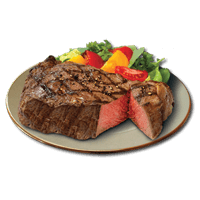
Chuck steak can be with bone or boneless. Chuck steak, which contains parts of the shoulder bone, is called 7-bone steak, named for its shape. This cut can be tougher than others and is usually slow-cooked
Depending on the precise cut, boneless variations of chuck steak are chuck eye steak (chuck tender steak or mock tender steak), chuck fillet, cross-rib roast, top-blade steak, under-blade steak, shoulder steak, and arm steak.
Nutrition
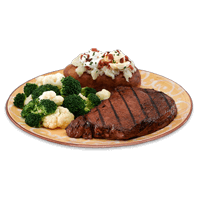
This article, including the infographics below, will focus on the nutritional profile of a 100g serving of grilled boneless chuck eye steak with separable lean and fat, trimmed to 0" fat, all grades.
However, we will also discuss the nutrition of chuck eye steak with separable lean only and broiled mock tender steak with separable lean and fat (1, 2).
An average serving size of steak per person is about 3 ounces or 85g, while one steak weighs approximately 308g.
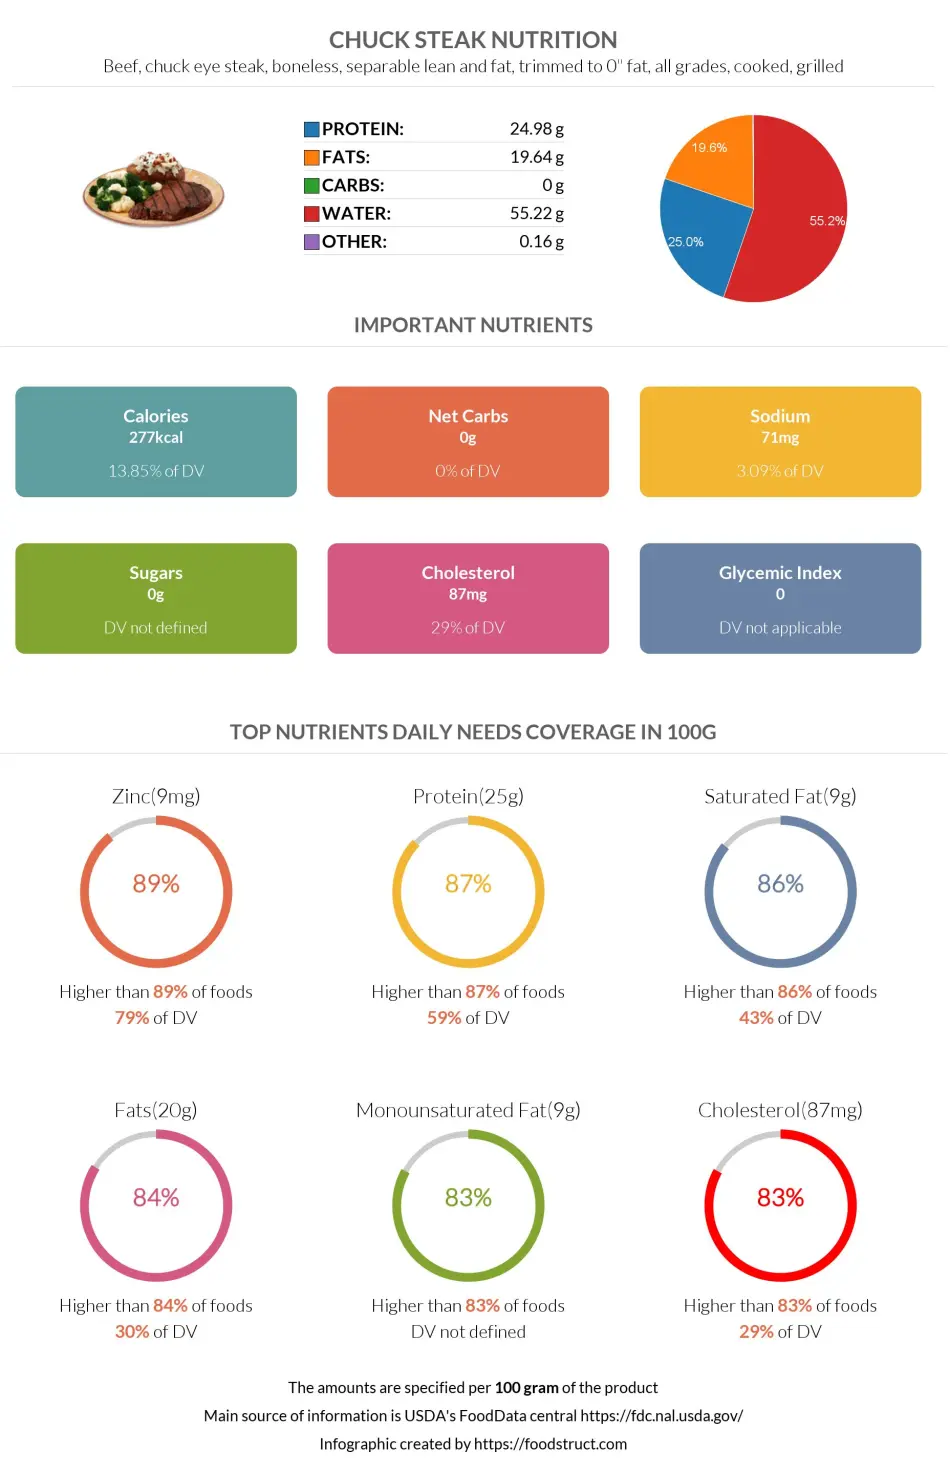
Chuck steak is rich in nutrients overall, consisting of 55% water, 25% protein, 20% fats, and 5% micronutrients.
Macronutrients chart
Calories
Calories per 100g
Chuck steak is a high-calorie food, with a 100g serving of chuck steak containing 277 calories.
These calories are most likely derived from the 24.98g protein and 19.64g fat content. Chuck steak provides 13.85% of daily calorie needs.
Chuck eye steak with lean meat only contains fewer calories, providing 209kcal per 100g. That being said, mock tender steak is even lower in calories, with 160 calories per 100g.
Calories per serving
The chuck steak is often consumed in amounts greater than 100 grams. One full chuck steak (308g) provides 644 calories, while 3oz (85g) of this meat contains 178 calories.
Comparison
Here, we will compare the calorie count of chuck steak to that of several other foods. According to our data, chuck steak has more calories than 67% of foods.
Chuck steak contains almost 2 times more calories than beefsteak but fewer calories than rib-eye steak.
You can find the comparison of the caloric values of chuck steak and other steak types in the table below.
| Food | Calories per 100 grams |
| Beefsteak | 134 |
| T bone steak | 217 |
| Steak | 271 |
| Porterhouse steak | 276 |
| Chuck steak | 277 |
| Ribeye steak | 291 |
Burning estimates
The table below illustrates how long it takes to burn 644 calories (one chuck steak) and what activity is necessary. The values were calculated using the MET method (Metabolic Equivalent of a Task) (3, 4).
| One steak - 70kg person | One steak - 100 kg person | |
| Walking | 3h 40min | 2h 35min |
| Running | 1h 9min | 48min |
| Cycling | 74 min | 52min |
Proteins
Chuck steak is rich in protein. It provides 77g of protein per full steak and 25g per 100g.
Chuck steak falls in the range of the top 13% of foods as a source of protein. One chuck steak can cover more than the daily need for protein for a person who weighs 75 kg.
Your daily protein need is about 0.8 g per kg of body weight.
Chuck eye steak with only lean meat and mock tender steak are both richer in proteins, providing 28g and 26g per 100g servings, respectively.
One chuck steak (308g) covers the daily needs of all essential amino acids, and a 100g serving covers these values for histidine, threonine, lysine, and tryptophan.
Protein quality breakdown
A 100g serving chuck eye steak contains 4.2g of branched-chain amino acids or BCAAs (leucine, isoleucine, and valine).
This serving of chuck steak also provides 3.5g of glycine, arginine, and methionine in total, the three amino acids used by the body to synthesize creatine.
Fats
Chuck eye steak is high in fats, containing 19.64g of fats per 100g. It is also accordingly high in saturated and monounsaturated fat. Chuck steak falls in the top 16% of foods as a source of fats.
Of these fats, 46% (8.66g) is saturated, 50% (9.4g) is monounsaturated, and 4% (0.8g) is polyunsaturated.
Fat type information
A 100g chuck eye steak also contains 1.29g of trans fats.
The same 100g serving size of lean chuck eye steak provides 10.8g. Lean chuck steak also contains about 2 times less trans fats.
Mock tender steak has even less fat - 5.5g per 100g.
Cholesterol
Chuck steak contains a high level of cholesterol - 87mg per 100g. It falls in the top 17% of foods as a source of cholesterol.
Lean chuck eye steak contains the same amount of cholesterol; however, mock tender steak is lower, providing 63mg per 100g.
Carbohydrates
Chuck steak, like most other types of meat, contains no carbohydrates.
Vitamins
Chuck steak is rich in most B-group vitamins.
A 100g serving of chuck steak covers 126% of the daily vitamin B12 (cobalamine) need, falling in the top 23% of foods as a source of this vitamin.
Chuck steak is also an excellent source of vitamin B2 (riboflavin), vitamin B3 (niacin), vitamin B5 (pantothenic acid), and vitamin B6 (pyridoxine).
It also has smaller amounts of vitamin B1, vitamin B9 or folate, and vitamins A, D, E, and K.
Chuck steak lacks vitamin C entirely.
Vitamin coverage chart
Minerals
Chuck steak has a high amount of zinc, iron, phosphorus, potassium, and selenium. It falls in the top 11% of foods as a source of zinc and the top 29% as a source of iron. One serving of chuck steak can cover your daily zinc need by 79% and selenium by 50%.
Chuck steak also provides moderate amounts of magnesium, copper, and calcium.
Grilled chuck steak is low in sodium and manganese.
Mineral coverage chart
Glycemic Index
Chuck steak can be considered a 0 glycemic index as it contains no carbohydrates. You can find more on information on the glycemic index of foods with no carbs.
You can also visit the glycemic index chart page for glycemic index values of other foods.
Insulin Index
The insulin index shows how much the blood insulin levels rise after consuming foods, giving us information for foods with no carbohydrates or glycemic index values.
The insulin index for topside lean beef steak has been calculated to be 51 (5). This is a moderate insulin index value. The insulin index of chuck eye steak can be assumed to be similar.
If interested, you can find the insulin index values for over 140 other foods.
Acidity
Chuck steak has a PRAL or potential renal acid value of 11.8, making it an acid-producing food. The higher this value, the more acid-forming the food is.
Comparison to Similar Foods
We compared chuck steak to other foods in our database and highlighted which one contains more macronutrients.
Chuck steak has more vitamin B12, zinc, iron, and monounsaturated fat than flank steak.
Compared with beefsteak, chuck steak provides more zinc, vitamin B12, iron, polyunsaturated fat, and monounsaturated fat.
References
- https://fdc.nal.usda.gov/fdc-app.html#/food-details/170801/nutrients
- https://fdc.nal.usda.gov/fdc-app.html#/food-details/174025/nutrients
- https://www.ncbi.nlm.nih.gov/pmc/articles/PMC4428382/
- 2011 Compendium of Physical Activities
- https://academic.oup.com/ajcn/article/66/5/1264/4655967

Top nutrition facts for Chuck steak
| Calories ⓘ Calories for selected serving | 277 kcal |
|
Glycemic index ⓘ
Source: The food is assumed to have 0 or no glycemic index bason on the fact that it has no carbs and that foods with 0 carbs have no glycemic index
Check out our Glycemic index chart page for the full list.
|
0 (low) |
| Glycemic load ⓘ Glycemic Load (GL) is a metric that measures both the quality (Glycemic Index) and quantity of carbohydrates in a specific serving of food to estimate its impact on blood sugar levels. It is calculated as: (GI × Carbs in grams) / 100. | 0 (low) |
| Net carbs ⓘ Net Carbs = Total Carbohydrates – Fiber – Sugar Alcohols | 0 g |
| Default serving size ⓘ Serving sizes are mostly taken from FDA's Reference Amounts Customarily Consumed (RACCs) | 1 steak (308 g) |
| Acidity (Based on PRAL) ⓘ PRAL (Potential renal acid load) is calculated using a formula. On the PRAL scale the higher the positive value, the more is the acidifying effect on the body. The lower the negative value, the higher the alkalinity of the food. 0 is neutral. | 11.8 (acidic) |
| Oxalates | 0 mg ⓘ Animal products do not contain oxalate. |
Chuck steak calories (kcal)
| Calories for different serving sizes of chuck steak | Calories | Weight |
|---|---|---|
| Calories in 100 grams | 277 | |
| Calories in 3 oz | 235 | 85 g |
| Calories in 1 steak | 853 | 308 g |
Extra Nutrition facts for Chuck steak
| Protein per 100 calories ⓘ Shows how many grams of protein you get from 100 calories of this food, calculated as (protein in g ÷ calories) × 100. | 9 g |
| Calories per 10 g protein ⓘ Shows how many calories you need to eat from this food to get 10 g of protein, calculated as (calories ÷ protein in g) × 10. | 111 kcal |
| Weight per 100 calories ⓘ Shows how many grams of this food equal 100 kcal—higher grams mean a larger portion for the same calories. | 36 g |
| Unsaturated / Saturated Fat ratio ⓘ (monounsaturated + polyunsaturated) / saturated, ≥2 broadly recommended by major guidelines for heart health | 1.2 |
Chuck steak Glycemic index (GI)
Mineral chart - relative view
Vitamin chart - relative view
All nutrients for Chuck steak per 100g
| Nutrient | Value | DV% | In TOP % of foods | Comparison |
| Vitamin A | 7µg | 1% | 37% | |
| Calories | 277kcal | 14% | 33% |
5.9 times more than Orange
|
| Protein per 100 calories | 9g | N/A | 29% | |
| Calories per 10 g protein | 111kcal | N/A | 68% | |
| Protein | 25g | 59% | 13% |
8.9 times more than Broccoli
|
| Weight per 100 calories | 36g | N/A | 67% | |
| Fats | 20g | 30% | 16% |
1.7 times less than Cheese
|
| Unsaturated / Saturated Fat ratio | 1.2 | N/A | 70% | |
| Vitamin C | 0mg | 0% | 100% |
N/A
|
| Net carbs | 0g | N/A | 100% |
N/A
|
| Carbs | 0g | 0% | 100% |
N/A
|
| Cholesterol | 87mg | 29% | 13% |
4.3 times less than Egg
|
| Vitamin D* | 5 IU | 1% | 19% |
17.4 times less than Egg
|
| Vitamin D | 0.1µg | 1% | 24% |
22 times less than Egg
|
| Magnesium | 22mg | 5% | 46% |
6.4 times less than Almonds
|
| Calcium | 16mg | 2% | 58% |
7.8 times less than Milk
|
| Potassium | 325mg | 10% | 27% |
2.2 times more than Cucumber
|
| Iron | 2.5mg | 31% | 28% |
1.1 times less than Beef broiled
|
| Sugar | 0g | N/A | 100% |
N/A
|
| Fiber | 0g | 0% | 100% |
N/A
|
| Copper | 0.08mg | 9% | 51% |
1.8 times less than Shiitake
|
| Zinc | 8.7mg | 79% | 3% |
1.4 times more than Beef broiled
|
| Phosphorus | 193mg | 28% | 34% |
1.1 times more than Chicken meat
|
| Sodium | 71mg | 3% | 57% |
6.9 times less than White bread
|
| Vitamin E | 0.1mg | 1% | 54% |
14.6 times less than Kiwi
|
| Manganese | 0.01mg | 1% | 63% | |
| Selenium | 28µg | 50% | 16% | |
| Vitamin B1 | 0.07mg | 6% | 57% |
4 times less than Pea raw
|
| Vitamin B2 | 0.19mg | 15% | 41% |
1.5 times more than Avocado
|
| Vitamin B3 | 4.7mg | 29% | 29% |
2.1 times less than Turkey meat
|
| Vitamin B5 | 0.75mg | 15% | 18% |
1.5 times less than Sunflower seeds
|
| Vitamin B6 | 0.37mg | 29% | 24% |
3.1 times more than Oats
|
| Vitamin B12 | 3µg | 126% | 9% |
4.3 times more than Pork
|
| Vitamin K | 1.6µg | 1% | 30% |
63.5 times less than Broccoli
|
| Folate | 6µg | 2% | 62% |
10.2 times less than Brussels sprouts
|
| Trans fat | 1.3g | N/A | 2% |
11.6 times less than Margarine
|
| Choline | 79mg | 14% | 11% | |
| Saturated fat | 8.7g | 43% | 11% |
1.5 times more than Beef broiled
|
| Monounsaturated fat | 9.5g | N/A | 10% |
Equal to Avocado
|
| Polyunsaturated fat | 0.81g | N/A | 43% |
58.2 times less than Walnut
|
| Tryptophan | 0.28mg | 0% | 11% |
1.1 times less than Chicken meat
|
| Threonine | 1.1mg | 0% | 11% |
1.5 times more than Beef broiled
|
| Isoleucine | 1.1mg | 0% | 16% |
1.2 times more than Salmon raw
|
| Leucine | 2mg | 0% | 13% |
1.2 times less than Tuna Bluefin
|
| Lysine | 2.2mg | 0% | 12% |
4.8 times more than Tofu
|
| Methionine | 0.71mg | 0% | 10% |
7.4 times more than Quinoa
|
| Phenylalanine | 0.95mg | 0% | 15% |
1.4 times more than Egg
|
| Valine | 1.1mg | 0% | 16% |
1.8 times less than Soybean raw
|
| Histidine | 0.81mg | 0% | 13% |
1.1 times more than Turkey meat
|
| Caffeine | 0mg | 0% | 100% | |
| Omega-3 - EPA | 0g | N/A | 20% |
690 times less than Salmon
|
| Omega-3 - DHA | 0g | N/A | 100% |
N/A
|
| Omega-3 - ALA | 0.04g | N/A | 13% |
222.9 times less than Canola oil
|
| Omega-3 - DPA | 0g | N/A | 18% |
42.5 times less than Salmon
|
| Omega-6 - Eicosadienoic acid | 0.01g | N/A | 10% | |
| Omega-6 - Linoleic acid | 0.62g | N/A | 10% |
19.9 times less than Almonds
|
Check out similar food or compare with current
NUTRITION FACTS LABEL
Serving Size ______________
Health checks
Chuck steak nutrition infographic
References
All the values for which the sources are not specified explicitly are taken from FDA’s Food Central. The exact link to the food presented on this page can be found below.