Chunky bar vs. Reese's fast break — In-Depth Nutrition Comparison
Compare
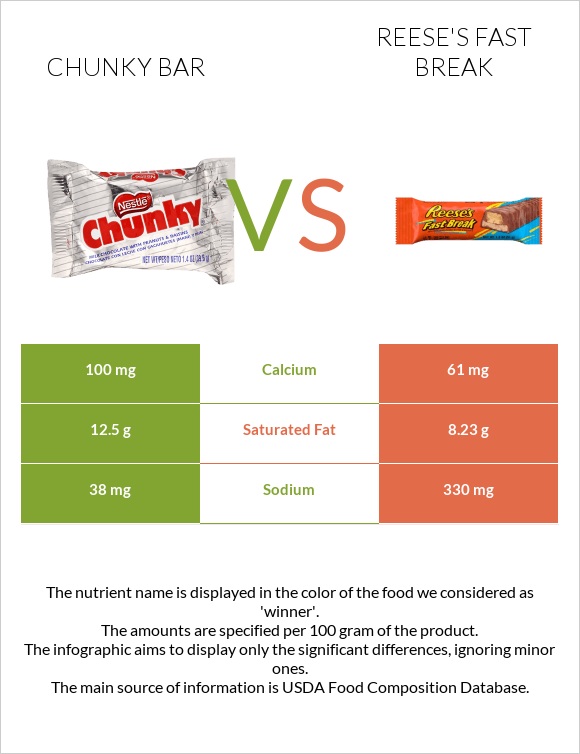
Differences between chunky bar and reese's fast break
- Chunky bar's daily need coverage for saturated fat is 21% higher.
- Reese's fast break contains 2 times less calcium than chunky bar. Chunky bar contains 100mg of calcium, while reese's fast break contains 61mg.
- The amount of saturated fat in reese's fast break is lower.
The food types used in this comparison are Candies, NESTLE, CHUNKY Bar and Candies, REESE'S, FAST BREAK, milk chocolate peanut butter and soft nougats.
Infographic
Infographic link
Mineral Comparison
Mineral comparison score is based on the number of minerals by which one or the other food is richer. The "coverage" charts below show how much of the daily needs can be covered by 300 grams of the food.
| Contains more CalciumCalcium | +63.9% |
| Contains less SodiumSodium | -88.5% |
Vitamin Comparison
Vitamin comparison score is based on the number of vitamins by which one or the other food is richer. The "coverage" charts below show how much of the daily needs can be covered by 300 grams of the food.
| Contains more Vitamin CVitamin C | +∞% |
All nutrients comparison - raw data values
| Nutrient |  |
 |
DV% diff. |
| Polyunsaturated fat | 4.33g | 29% | |
| Vitamin B3 | 3.57mg | 22% | |
| Monounsaturated fat | 8.94g | 22% | |
| Copper | 0.18mg | 20% | |
| Phosphorus | 130mg | 19% | |
| Saturated fat | 12.5g | 8.23g | 19% |
| Sodium | 38mg | 330mg | 13% |
| Magnesium | 48mg | 11% | |
| Vitamin B1 | 0.13mg | 11% | |
| Folate | 39µg | 10% | |
| Zinc | 0.94mg | 9% | |
| Potassium | 284mg | 8% | |
| Vitamin B2 | 0.1mg | 8% | |
| Vitamin B5 | 0.42mg | 8% | |
| Fats | 27.5g | 23.42g | 6% |
| Vitamin B6 | 0.07mg | 5% | |
| Calcium | 100mg | 61mg | 4% |
| Protein | 7.5g | 8.66g | 2% |
| Cholesterol | 10mg | 4mg | 2% |
| Fiber | 2.5g | 2.9g | 2% |
| Carbs | 60g | 61.6g | 1% |
| Iron | 0.9mg | 0.96mg | 1% |
| Calories | 475kcal | 474kcal | 0% |
| Protein per 100 calories | 1.6g | 1.8g | N/A |
| Calories per 10 g protein | 633kcal | 547kcal | N/A |
| Weight per 100 calories | 21g | 21g | N/A |
| Unsaturated / Saturated Fat ratio | 0 | 1.6 | N/A |
| Vitamin C | 0mg | 0.4mg | 0% |
| Net carbs | 57.5g | 58.7g | N/A |
| Sugar | 52.5g | 53.08g | N/A |
| Trans fat | 0.16g | 0g | N/A |
Macronutrient Comparison
Macronutrient breakdown side-by-side comparison
Protein:
7.5 g
Fats:
27.5 g
Carbs:
60 g
Water:
2.9 g
Other:
2.1 g
Protein:
8.66 g
Fats:
23.42 g
Carbs:
61.6 g
Water:
4.1 g
Other:
2.22 g
| Contains more FatsFats | +17.4% |
| Contains more ProteinProtein | +15.5% |
| Contains more WaterWater | +41.4% |
~equal in
Carbs
~61.6g
~equal in
Other
~2.22g
Fat Type Comparison
Fat type breakdown side-by-side comparison
Saturated fat:
Sat. Fat
12.5 g
Monounsaturated fat:
Mono. Fat
0 g
Polyunsaturated fat:
Poly. Fat
0 g
Saturated fat:
Sat. Fat
8.23 g
Monounsaturated fat:
Mono. Fat
8.94 g
Polyunsaturated fat:
Poly. Fat
4.33 g
| Contains less Sat. FatSaturated fat | -34.2% |


