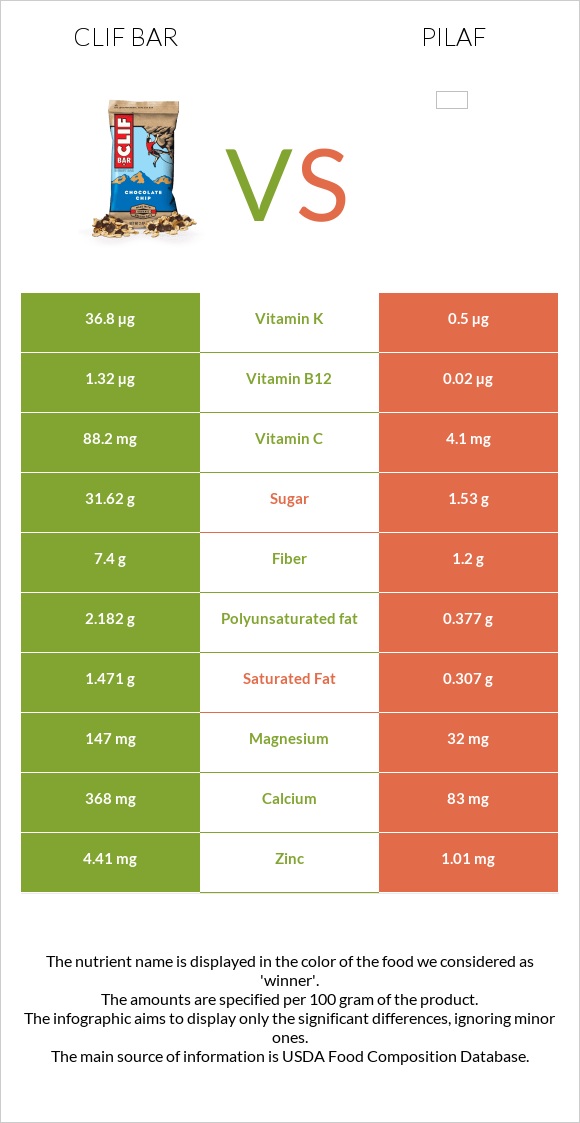
Summary of differences between clif Bar and pilaf The amount of vitamin C, manganese, vitamin B12, iron, zinc, copper, vitamin K, vitamin B5, and calcium in clif Bar is higher than in pilaf. Clif Bar covers your daily need for vitamin C, 93% more than pilaf. Clif Bar contains 74 times more vitamin K than pilaf. While clif Bar contains 36.8µg of vitamin K, pilaf contains only 0.5µg. The amount of sodium in clif Bar is lower. These are the specific foods used in this comparison Snacks, CLIF BAR, mixed flavors and Rice and vermicelli mix, rice pilaf flavor, unprepared .
Infographic
Mineral Comparison
Mineral comparison score is based on the number of minerals by which one or the other food is richer. The "coverage" charts below show how much of the daily needs can be covered by 300 grams of the food.
9
100 g
300 g
1 bar - 68g
Magnesium
Magnesium
Calcium
Calcium
Potassium
Potassium
Iron
Iron
Copper
Copper
Zinc
Zinc
Phosphorus
Phosphorus
Sodium
Sodium
Manganese
Manganese
Selenium
Selenium
105%
110%
36%
248%
147%
120%
126%
25%
280%
112%
1
100 g
300 g
1 tbsp - 9.6g 0.333 cup - 68g
Magnesium
Magnesium
Calcium
Calcium
Potassium
Potassium
Iron
Iron
Copper
Copper
Zinc
Zinc
Phosphorus
Phosphorus
Sodium
Sodium
Manganese
Manganese
Selenium
Selenium
23%
25%
17%
92%
55%
28%
66%
170%
115%
177%
Vitamin Comparison
Vitamin comparison score is based on the number of vitamins by which one or the other food is richer. The "coverage" charts below show how much of the daily needs can be covered by 300 grams of the food.
7
100 g
300 g
1 bar - 68g
Vitamin C
Vit. C
Vitamin D
Vit. D
Vitamin A
Vit. A
Vitamin E
Vit. E
Vitamin B1
Vit. B1
Vitamin B2
Vit. B2
Vitamin B3
Vit. B3
Vitamin B5
Vit. B5
Vitamin B6
Vit. B6
Vitamin B12
Vit. B12
Vitamin K
Vit. K
Folate
Folate
294%
0%
0.33%
4.8%
138%
87%
83%
132%
136%
165%
92%
89%
3
100 g
300 g
1 tbsp - 9.6g 0.333 cup - 68g
Vitamin C
Vit. C
Vitamin D
Vit. D
Vitamin A
Vit. A
Vitamin E
Vit. E
Vitamin B1
Vit. B1
Vitamin B2
Vit. B2
Vitamin B3
Vit. B3
Vitamin B5
Vit. B5
Vitamin B6
Vit. B6
Vitamin B12
Vit. B12
Vitamin K
Vit. K
Folate
Folate
14%
0%
1.3%
0.8%
151%
20%
115%
43%
92%
2.5%
1.3%
159%
All nutrients comparison - raw data values
Nutrient
DV% diff.
Vitamin C
88.2mg
4.1mg
93%
Manganese
2.146mg
0.882mg
55%
Vitamin B12
1.32µg
0.02µg
54%
Iron
6.62mg
2.44mg
52%
Sodium
195mg
1303mg
48%
Copper
0.441mg
0.166mg
31%
Zinc
4.41mg
1.01mg
31%
Vitamin B5
2.206mg
0.715mg
30%
Vitamin K
36.8µg
0.5µg
30%
Calcium
368mg
83mg
29%
Starch
71.23g
29%
Magnesium
147mg
32mg
27%
Fiber
7.4g
1.2g
25%
Folate
118µg
212µg
24%
Vitamin B2
0.375mg
0.087mg
22%
Selenium
20.6µg
32.4µg
21%
Phosphorus
294mg
154mg
20%
Vitamin B6
0.588mg
0.4mg
14%
Polyunsaturated fat
2.182g
0.377g
12%
Vitamin B3
4.412mg
6.127mg
11%
Protein
14.71g
10.42g
9%
Fats
5.88g
1.37g
7%
Potassium
412mg
188mg
7%
Choline
46.2mg
17.5mg
5%
Saturated fat
1.471g
0.307g
5%
Carbs
65.44g
76.31g
4%
Vitamin B1
0.551mg
0.603mg
4%
Monounsaturated fat
1.093g
0.373g
2%
Calories
346kcal
359kcal
1%
Vitamin E
0.24mg
0.04mg
1%
Protein per 100 calories
4.3g
2.9g
N/A
Calories per 10 g protein
235kcal
345kcal
N/A
Weight per 100 calories
29g
28g
N/A
Unsaturated / Saturated Fat ratio
2.2
2.4
N/A
Net carbs
58.04g
75.11g
N/A
Cholesterol
0mg
1mg
0%
Sugar
31.62g
1.53g
N/A
Vitamin A
1µg
4µg
0%
Tryptophan
0.086mg
0%
Threonine
0.221mg
0%
Isoleucine
0.279mg
0%
Leucine
0.523mg
0%
Lysine
0.189mg
0%
Methionine
0.145mg
0%
Phenylalanine
0.32mg
0%
Valine
0.374mg
0%
Histidine
0.15mg
0%
Macronutrient Comparison
Macronutrient breakdown side-by-side comparison
3
15%
6%
65%
11%
3%
Protein:
14.71 g
Fats:
5.88 g
Carbs:
65.44 g
Water:
11 g
Other:
2.97 g
2
10%
76%
8%
4%
Protein:
10.42 g
Fats:
1.37 g
Carbs:
76.31 g
Water:
8.04 g
Other:
3.86 g
Contains
more
Protein Protein
+41.2%
Contains
more
Fats Fats
+329.2%
Contains
more
Water Water
+36.8%
Contains
more
Carbs Carbs
+16.6%
Contains
more
Other Other
+30%
Fat Type Comparison
Fat type breakdown side-by-side comparison
2
31%
23%
46%
Saturated fat:
Sat. Fat
1.471 g
Monounsaturated fat:
Mono. Fat
1.093 g
Polyunsaturated fat:
Poly. Fat
2.182 g
1
29%
35%
36%
Saturated fat:
Sat. Fat
0.307 g
Monounsaturated fat:
Mono. Fat
0.373 g
Polyunsaturated fat:
Poly. Fat
0.377 g
Contains
more
Mono. Fat Monounsaturated fat
+193%
Contains
more
Poly. Fat Polyunsaturated fat
+478.8%
Contains
less
Sat. Fat Saturated fat
-79.1%