Cloudberry vs. Lentil soup — In-Depth Nutrition Comparison
Compare
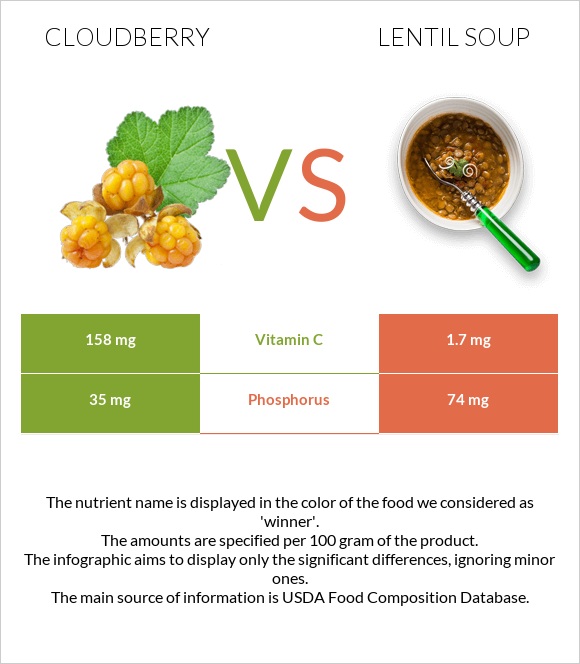
The main differences between cloudberries and lentil soup
- Cloudberries are richer in vitamin C, yet lentil soup is richer in phosphorus.
- Daily need coverage for vitamin C for cloudberries is 174% higher.
Food types used in this article are Cloudberries, raw (Alaska Native) and Soup, lentil with ham, canned, ready-to-serve.
Infographic
Infographic link
Mineral Comparison
Mineral comparison score is based on the number of minerals by which one or the other food is richer. The "coverage" charts below show how much of the daily needs can be covered by 300 grams of the food.
| Contains less SodiumSodium | -100% |
| Contains more IronIron | +52.9% |
| Contains more PhosphorusPhosphorus | +111.4% |
Vitamin Comparison
Vitamin comparison score is based on the number of vitamins by which one or the other food is richer. The "coverage" charts below show how much of the daily needs can be covered by 300 grams of the food.
| Contains more Vitamin CVitamin C | +9194.1% |
| Contains more Vitamin B2Vitamin B2 | +55.6% |
| Contains more Vitamin B3Vitamin B3 | +65.1% |
| Contains more Vitamin B1Vitamin B1 | +40% |
All nutrients comparison - raw data values
| Nutrient |  |
 |
DV% diff. |
| Vitamin C | 158mg | 1.7mg | 174% |
| Sodium | 532mg | 23% | |
| Copper | 0.07mg | 8% | |
| Vitamin B6 | 0.09mg | 7% | |
| Phosphorus | 35mg | 74mg | 6% |
| Iron | 0.7mg | 1.07mg | 5% |
| Manganese | 0.12mg | 5% | |
| Vitamin B12 | 0.12µg | 5% | |
| Folate | 20µg | 5% | |
| Potassium | 144mg | 4% | |
| Protein | 2.4g | 3.74g | 3% |
| Zinc | 0.3mg | 3% | |
| Vitamin B5 | 0.14mg | 3% | |
| Magnesium | 9mg | 2% | |
| Vitamin B1 | 0.05mg | 0.07mg | 2% |
| Vitamin B2 | 0.07mg | 0.045mg | 2% |
| Vitamin B3 | 0.9mg | 0.545mg | 2% |
| Saturated fat | 0.45g | 2% | |
| Cholesterol | 3mg | 1% | |
| Vitamin A | 7µg | 1% | |
| Selenium | 0.3µg | 1% | |
| Monounsaturated fat | 0.52g | 1% | |
| Polyunsaturated fat | 0.13g | 1% | |
| Calories | 51kcal | 56kcal | 0% |
| Fats | 0.8g | 1.12g | 0% |
| Net carbs | 8.6g | 8.16g | N/A |
| Carbs | 8.6g | 8.16g | 0% |
| Calcium | 18mg | 17mg | 0% |
Macronutrient Comparison
Macronutrient breakdown side-by-side comparison
Protein:
2.4 g
Fats:
0.8 g
Carbs:
8.6 g
Water:
87 g
Other:
1.2 g
Protein:
3.74 g
Fats:
1.12 g
Carbs:
8.16 g
Water:
85.75 g
Other:
1.23 g
| Contains more ProteinProtein | +55.8% |
| Contains more FatsFats | +40% |
~equal in
Carbs
~8.16g
~equal in
Water
~85.75g
~equal in
Other
~1.23g


