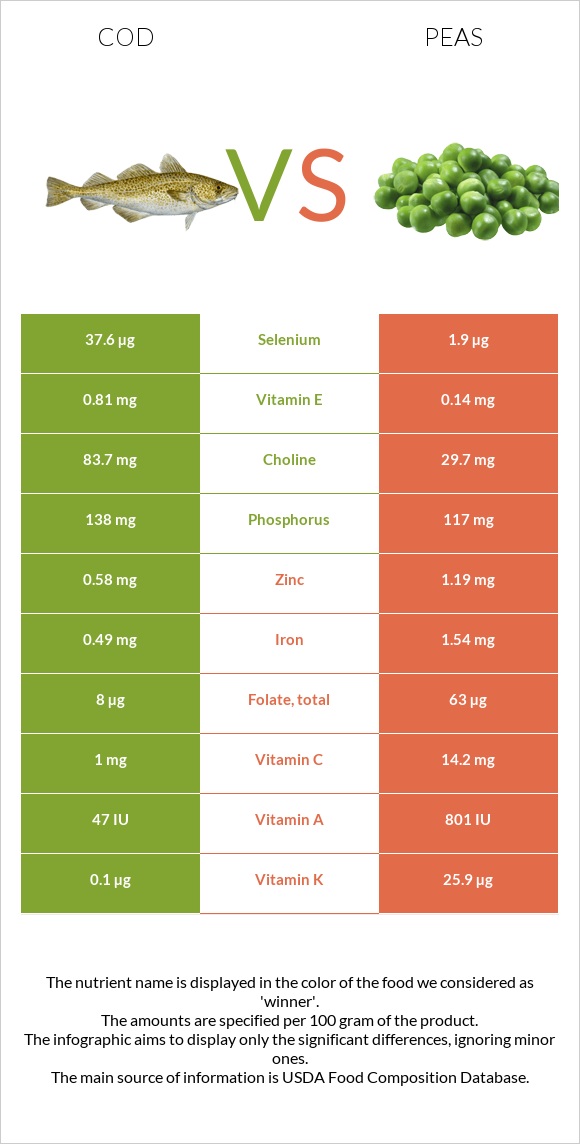
Differences between cod and peas Cod has more selenium and vitamin B12, while peas have more vitamin B5, fiber, manganese, vitamin K, copper, vitamin A, and vitamin C. Peas' daily need coverage for vitamin B5 is 3056% higher. The amount of cholesterol in peas is lower. Cod has a lower glycemic index. The glycemic index of cod is 0, while the glycemic index of peas is 54. The food types used in this comparison are Fish, cod, Atlantic, cooked, dry heat and Peas, green, cooked, boiled, drained, without salt .
Infographic
Mineral Comparison
Mineral comparison score is based on the number of minerals by which one or the other food is richer. The "coverage" charts below show how much of the daily needs can be covered by 300 grams of the food.
2
100 g
300 g
3 oz - 85g 1 fillet - 180g
Magnesium
Magnesium
Calcium
Calcium
Potassium
Potassium
Iron
Iron
Copper
Copper
Zinc
Zinc
Phosphorus
Phosphorus
Sodium
Sodium
Manganese
Manganese
Selenium
Selenium
30%
4.2%
22%
18%
12%
16%
59%
10%
2.6%
205%
7
100 g
300 g
1 cup - 160g
Magnesium
Magnesium
Calcium
Calcium
Potassium
Potassium
Iron
Iron
Copper
Copper
Zinc
Zinc
Phosphorus
Phosphorus
Sodium
Sodium
Manganese
Manganese
Selenium
Selenium
28%
8.1%
24%
58%
58%
32%
50%
0.39%
68%
10%
Vitamin Comparison
Vitamin comparison score is based on the number of vitamins by which one or the other food is richer. The "coverage" charts below show how much of the daily needs can be covered by 300 grams of the food.
5
100 g
300 g
3 oz - 85g 1 fillet - 180g
Vitamin C
Vit. C
Vitamin D
Vit. D
Vitamin A
Vit. A
Vitamin E
Vit. E
Vitamin B1
Vit. B1
Vitamin B2
Vit. B2
Vitamin B3
Vit. B3
Vitamin B5
Vit. B5
Vitamin B6
Vit. B6
Vitamin B12
Vit. B12
Vitamin K
Vit. K
Folate
Folate
3.3%
18%
4.7%
16%
22%
18%
47%
11%
65%
131%
0.25%
6%
7
100 g
300 g
1 cup - 160g
Vitamin C
Vit. C
Vitamin D
Vit. D
Vitamin A
Vit. A
Vitamin E
Vit. E
Vitamin B1
Vit. B1
Vitamin B2
Vit. B2
Vitamin B3
Vit. B3
Vitamin B5
Vit. B5
Vitamin B6
Vit. B6
Vitamin B12
Vit. B12
Vitamin K
Vit. K
Folate
Folate
47%
0%
13%
2.8%
65%
34%
38%
9180%
50%
0%
65%
47%
All nutrients comparison - raw data values
Nutrient
DV% diff.
Vitamin B5
0.18mg
153mg
3056%
Selenium
37.6µg
1.9µg
65%
Vitamin B12
1.05µg
0µg
44%
Protein
22.83g
5.36g
35%
Fiber
0g
5.5g
22%
Manganese
0.02mg
0.525mg
22%
Vitamin K
0.1µg
25.9µg
22%
Cholesterol
55mg
0mg
18%
Vitamin C
1mg
14.2mg
15%
Copper
0.036mg
0.173mg
15%
Vitamin B1
0.088mg
0.259mg
14%
Folate
8µg
63µg
14%
Iron
0.49mg
1.54mg
13%
Choline
83.7mg
29.7mg
10%
Vitamin D*
46 IU
0 IU
6%
Vitamin D
1.2µg
0µg
6%
Zinc
0.58mg
1.19mg
6%
Carbs
0g
15.63g
5%
Vitamin B2
0.079mg
0.149mg
5%
Vitamin B6
0.283mg
0.216mg
5%
Vitamin E
0.81mg
0.14mg
4%
Phosphorus
138mg
117mg
3%
Sodium
78mg
3mg
3%
Vitamin A
14µg
40µg
3%
Vitamin B3
2.513mg
2.021mg
3%
Calories
105kcal
84kcal
1%
Fats
0.86g
0.22g
1%
Magnesium
42mg
39mg
1%
Calcium
14mg
27mg
1%
Potassium
244mg
271mg
1%
Saturated fat
0.168g
0.039g
1%
Polyunsaturated fat
0.292g
0.102g
1%
Fructose
0.41g
1%
Protein per 100 calories
22g
6.4g
N/A
Calories per 10 g protein
46kcal
157kcal
N/A
Weight per 100 calories
95g
119g
N/A
Net carbs
0g
10.13g
N/A
Sugar
0g
5.93g
N/A
Monounsaturated fat
0.124g
0.019g
0%
Tryptophan
0.256mg
0.037mg
0%
Threonine
1.001mg
0.201mg
0%
Isoleucine
1.052mg
0.193mg
0%
Leucine
1.856mg
0.32mg
0%
Lysine
2.097mg
0.314mg
0%
Methionine
0.676mg
0.081mg
0%
Phenylalanine
0.891mg
0.198mg
0%
Valine
1.176mg
0.232mg
0%
Histidine
0.672mg
0.105mg
0%
Omega-3 - EPA
0.004g
0g
N/A
Omega-3 - DHA
0.154g
0g
N/A
Omega-3 - DPA
0.013g
0g
N/A
Macronutrient Comparison
Macronutrient breakdown side-by-side comparison
2
23%
76%
Protein:
22.83 g
Fats:
0.86 g
Carbs:
0 g
Water:
75.92 g
Other:
0.39 g
3
5%
16%
78%
Protein:
5.36 g
Fats:
0.22 g
Carbs:
15.63 g
Water:
77.87 g
Other:
0.92 g
Contains
more
Protein Protein
+325.9%
Contains
more
Fats Fats
+290.9%
Contains
more
Carbs Carbs
+∞%
Contains
more
Other Other
+135.9%
Fat Type Comparison
Fat type breakdown side-by-side comparison
2
29%
21%
50%
Saturated fat:
Sat. Fat
0.168 g
Monounsaturated fat:
Mono. Fat
0.124 g
Polyunsaturated fat:
Poly. Fat
0.292 g
1
24%
12%
64%
Saturated fat:
Sat. Fat
0.039 g
Monounsaturated fat:
Mono. Fat
0.019 g
Polyunsaturated fat:
Poly. Fat
0.102 g
Contains
more
Mono. Fat Monounsaturated fat
+552.6%
Contains
more
Poly. Fat Polyunsaturated fat
+186.3%
Contains
less
Sat. Fat Saturated fat
-76.8%