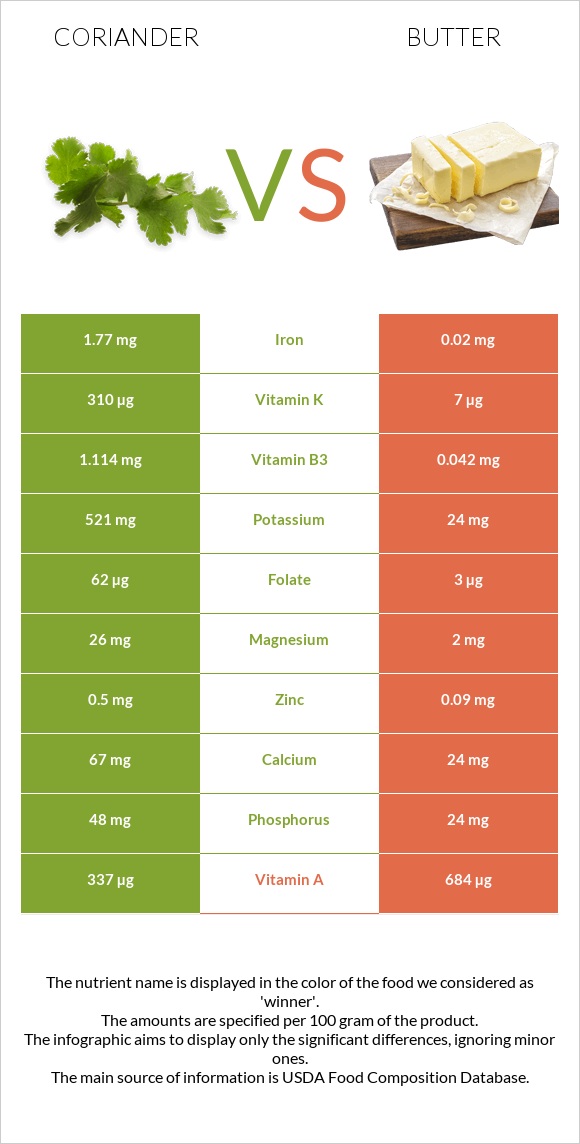
Significant differences between coriander and butter The amount of vitamin K, vitamin A, vitamin C, copper, iron, manganese, folate, and potassium in coriander is higher than in butter. Coriander covers your daily vitamin K needs 252% more than butter. Coriander contains less saturated fat. Coriander has a higher glycemic index. The glycemic index of coriander is 32, while the glycemic index of butter is 0. Specific food types used in this comparison are Coriander (cilantro) leaves, raw and Butter, without salt .
Infographic
Mineral Comparison
Mineral comparison score is based on the number of minerals by which one or the other food is richer. The "coverage" charts below show how much of the daily needs can be covered by 300 grams of the food.
8
100 g
300 g
0.25 cup - 4g 9 sprigs - 20g
Magnesium
Magnesium
Calcium
Calcium
Potassium
Potassium
Iron
Iron
Copper
Copper
Zinc
Zinc
Phosphorus
Phosphorus
Sodium
Sodium
Manganese
Manganese
Selenium
Selenium
19%
20%
46%
66%
75%
14%
21%
6%
56%
4.9%
2
100 g
300 g
1 pat (1" sq, 1/3" high) - 5g 1 tbsp - 14.2g 1 stick - 113g 1 cup - 227g
Magnesium
Magnesium
Calcium
Calcium
Potassium
Potassium
Iron
Iron
Copper
Copper
Zinc
Zinc
Phosphorus
Phosphorus
Sodium
Sodium
Manganese
Manganese
Selenium
Selenium
1.4%
7.2%
2.1%
0.75%
5.3%
2.5%
10%
1.4%
0.52%
5.5%
Vitamin Comparison
Vitamin comparison score is based on the number of vitamins by which one or the other food is richer. The "coverage" charts below show how much of the daily needs can be covered by 300 grams of the food.
8
100 g
300 g
0.25 cup - 4g 9 sprigs - 20g
Vitamin C
Vit. C
Vitamin D
Vit. D
Vitamin A
Vit. A
Vitamin E
Vit. E
Vitamin B1
Vit. B1
Vitamin B2
Vit. B2
Vitamin B3
Vit. B3
Vitamin B5
Vit. B5
Vitamin B6
Vit. B6
Vitamin B12
Vit. B12
Vitamin K
Vit. K
Folate
Folate
90%
0%
112%
50%
17%
37%
21%
34%
34%
0%
775%
47%
2
100 g
300 g
1 pat (1" sq, 1/3" high) - 5g 1 tbsp - 14.2g 1 stick - 113g 1 cup - 227g
Vitamin C
Vit. C
Vitamin D
Vit. D
Vitamin A
Vit. A
Vitamin E
Vit. E
Vitamin B1
Vit. B1
Vitamin B2
Vit. B2
Vitamin B3
Vit. B3
Vitamin B5
Vit. B5
Vitamin B6
Vit. B6
Vitamin B12
Vit. B12
Vitamin K
Vit. K
Folate
Folate
0%
0%
228%
46%
1.3%
7.8%
0.79%
6.6%
0.69%
21%
18%
2.3%
All nutrients comparison - raw data values
Nutrient
DV% diff.
Vitamin K
310µg
7µg
253%
Saturated fat
0.014g
50.489g
229%
Fats
0.52g
81.11g
124%
Cholesterol
0mg
215mg
72%
Monounsaturated fat
0.275g
23.43g
58%
Vitamin A
337µg
684µg
39%
Calories
23kcal
717kcal
35%
Vitamin C
27mg
0mg
30%
Copper
0.225mg
0.016mg
23%
Iron
1.77mg
0.02mg
22%
Polyunsaturated fat
0.04g
3.01g
20%
Manganese
0.426mg
0.004mg
18%
Potassium
521mg
24mg
15%
Folate
62µg
3µg
15%
Fiber
2.8g
0g
11%
Vitamin B6
0.149mg
0.003mg
11%
Vitamin B2
0.162mg
0.034mg
10%
Vitamin B5
0.57mg
0.11mg
9%
Vitamin B3
1.114mg
0.042mg
7%
Vitamin B12
0µg
0.17µg
7%
Magnesium
26mg
2mg
6%
Vitamin B1
0.067mg
0.005mg
5%
Calcium
67mg
24mg
4%
Zinc
0.5mg
0.09mg
4%
Protein
2.13g
0.85g
3%
Phosphorus
48mg
24mg
3%
Sodium
46mg
11mg
2%
Carbs
3.67g
0.06g
1%
Vitamin E
2.5mg
2.32mg
1%
Choline
12.8mg
18.8mg
1%
Protein per 100 calories
9.3g
0.12g
N/A
Calories per 10 g protein
108kcal
8435kcal
N/A
Weight per 100 calories
435g
14g
N/A
Unsaturated / Saturated Fat ratio
23
0.52
N/A
Net carbs
0.87g
0.06g
N/A
Sugar
0.87g
0.06g
N/A
Selenium
0.9µg
1µg
0%
Tryptophan
0.012mg
0%
Threonine
0.038mg
0%
Isoleucine
0.051mg
0%
Leucine
0.083mg
0%
Lysine
0.067mg
0%
Methionine
0.021mg
0%
Phenylalanine
0.041mg
0%
Valine
0.057mg
0%
Histidine
0.023mg
0%
Omega-3 - ALA
0.315g
N/A
Omega-6 - Linoleic acid
2.166g
N/A
Macronutrient Comparison
Macronutrient breakdown side-by-side comparison
4
2%
4%
92%
Protein:
2.13 g
Fats:
0.52 g
Carbs:
3.67 g
Water:
92.21 g
Other:
1.47 g
1
81%
18%
Protein:
0.85 g
Fats:
81.11 g
Carbs:
0.06 g
Water:
17.94 g
Other:
0.04 g
Contains
more
Protein Protein
+150.6%
Contains
more
Carbs Carbs
+6016.7%
Contains
more
Water Water
+414%
Contains
more
Other Other
+3575%
Contains
more
Fats Fats
+15498.1%
Fat Type Comparison
Fat type breakdown side-by-side comparison
1
4%
84%
12%
Saturated fat:
Sat. Fat
0.014 g
Monounsaturated fat:
Mono. Fat
0.275 g
Polyunsaturated fat:
Poly. Fat
0.04 g
2
66%
30%
4%
Saturated fat:
Sat. Fat
50.489 g
Monounsaturated fat:
Mono. Fat
23.43 g
Polyunsaturated fat:
Poly. Fat
3.01 g
Contains
less
Sat. Fat Saturated fat
-100%
Contains
more
Mono. Fat Monounsaturated fat
+8420%
Contains
more
Poly. Fat Polyunsaturated fat
+7425%