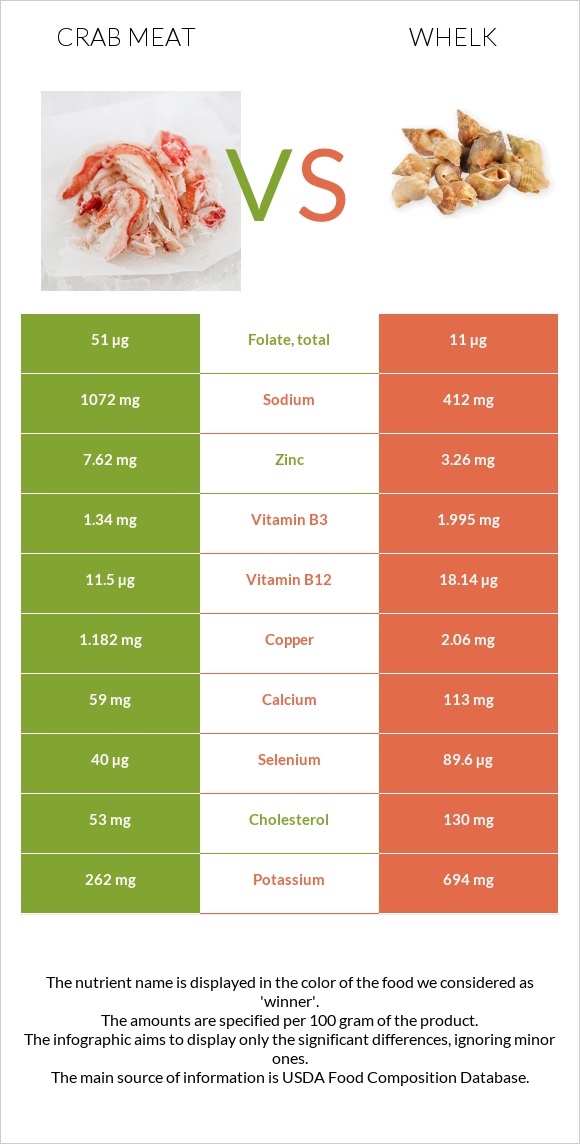
A recap on the differences between crab meat and whelk Crab meat is higher in zinc, yet whelk is higher in vitamin B12, iron, copper, selenium, manganese, vitamin B6, and magnesium. Whelk covers your daily vitamin B12 needs 277% more than crab meat. Crab meat contains 3 times more sodium than whelk. While crab meat contains 1072mg of sodium, whelk contains only 412mg. Food varieties used in this article are Crustaceans, crab, alaska king, cooked, moist heat and Mollusks, whelk, unspecified, cooked, moist heat .
Infographic
Mineral Comparison
Mineral comparison score is based on the number of minerals by which one or the other food is richer. The "coverage" charts below show how much of the daily needs can be covered by 300 grams of the food.
1
100 g
300 g
3 oz - 85g 1 leg - 134g
Magnesium
Magnesium
Calcium
Calcium
Potassium
Potassium
Iron
Iron
Copper
Copper
Zinc
Zinc
Phosphorus
Phosphorus
Sodium
Sodium
Manganese
Manganese
Selenium
Selenium
45%
18%
23%
29%
394%
208%
120%
140%
5.2%
218%
8
100 g
300 g
3 oz - 85g
Magnesium
Magnesium
Calcium
Calcium
Potassium
Potassium
Iron
Iron
Copper
Copper
Zinc
Zinc
Phosphorus
Phosphorus
Sodium
Sodium
Manganese
Manganese
Selenium
Selenium
123%
34%
61%
377%
687%
89%
121%
54%
116%
489%
Vitamin Comparison
Vitamin comparison score is based on the number of vitamins by which one or the other food is richer. The "coverage" charts below show how much of the daily needs can be covered by 300 grams of the food.
2
100 g
300 g
3 oz - 85g 1 leg - 134g
Vitamin C
Vit. C
Vitamin D
Vit. D
Vitamin A
Vit. A
Vitamin E
Vit. E
Vitamin B1
Vit. B1
Vitamin B2
Vit. B2
Vitamin B3
Vit. B3
Vitamin B5
Vit. B5
Vitamin B6
Vit. B6
Vitamin B12
Vit. B12
Vitamin K
Vit. K
Folate
Folate
25%
0%
3%
0%
13%
13%
25%
24%
42%
1438%
0%
38%
5
100 g
300 g
3 oz - 85g
Vitamin C
Vit. C
Vitamin D
Vit. D
Vitamin A
Vit. A
Vitamin E
Vit. E
Vitamin B1
Vit. B1
Vitamin B2
Vit. B2
Vitamin B3
Vit. B3
Vitamin B5
Vit. B5
Vitamin B6
Vit. B6
Vitamin B12
Vit. B12
Vitamin K
Vit. K
Folate
Folate
23%
0%
16%
0%
12%
49%
37%
24%
150%
2268%
0%
8.3%
All nutrients comparison - raw data values
Nutrient
DV% diff.
Vitamin B12
11.5µg
18.14µg
277%
Iron
0.76mg
10.06mg
116%
Copper
1.182mg
2.06mg
98%
Selenium
40µg
89.6µg
90%
Protein
19.35g
47.68g
57%
Zinc
7.62mg
3.26mg
40%
Manganese
0.04mg
0.89mg
37%
Vitamin B6
0.18mg
0.65mg
36%
Sodium
1072mg
412mg
29%
Cholesterol
53mg
130mg
26%
Magnesium
63mg
172mg
26%
Potassium
262mg
694mg
13%
Vitamin B2
0.055mg
0.214mg
12%
Folate
51µg
11µg
10%
Calories
97kcal
275kcal
9%
Carbs
0g
15.52g
5%
Calcium
59mg
113mg
5%
Vitamin A
9µg
49µg
4%
Vitamin B3
1.34mg
1.995mg
4%
Polyunsaturated fat
0.536g
0.046g
3%
Fats
1.54g
0.8g
1%
Vitamin C
7.6mg
6.8mg
1%
Protein per 100 calories
20g
17g
N/A
Calories per 10 g protein
50kcal
58kcal
N/A
Weight per 100 calories
103g
36g
N/A
Net carbs
0g
15.52g
N/A
Phosphorus
280mg
282mg
0%
Vitamin B1
0.053mg
0.049mg
0%
Vitamin B5
0.4mg
0.4mg
0%
Saturated fat
0.133g
0.062g
0%
Monounsaturated fat
0.185g
0.056g
0%
Tryptophan
0.269mg
0.618mg
0%
Threonine
0.783mg
2.136mg
0%
Isoleucine
0.938mg
1.655mg
0%
Leucine
1.536mg
3.807mg
0%
Lysine
1.684mg
2.93mg
0%
Methionine
0.545mg
1.205mg
0%
Phenylalanine
0.817mg
1.648mg
0%
Valine
0.91mg
2.075mg
0%
Histidine
0.393mg
0.977mg
0%
Omega-3 - EPA
0.295g
0.008g
N/A
Omega-3 - DHA
0.118g
0.012g
N/A
Omega-3 - DPA
0.031g
N/A
Macronutrient Comparison
Macronutrient breakdown side-by-side comparison
2
19%
78%
Protein:
19.35 g
Fats:
1.54 g
Carbs:
0 g
Water:
77.55 g
Other:
1.56 g
3
48%
16%
32%
4%
Protein:
47.68 g
Fats:
0.8 g
Carbs:
15.52 g
Water:
32 g
Other:
4 g
Contains
more
Fats Fats
+92.5%
Contains
more
Water Water
+142.3%
Contains
more
Protein Protein
+146.4%
Contains
more
Carbs Carbs
+∞%
Contains
more
Other Other
+156.4%
Fat Type Comparison
Fat type breakdown side-by-side comparison
2
16%
22%
63%
Saturated fat:
Sat. Fat
0.133 g
Monounsaturated fat:
Mono. Fat
0.185 g
Polyunsaturated fat:
Poly. Fat
0.536 g
1
38%
34%
28%
Saturated fat:
Sat. Fat
0.062 g
Monounsaturated fat:
Mono. Fat
0.056 g
Polyunsaturated fat:
Poly. Fat
0.046 g
Contains
more
Mono. Fat Monounsaturated fat
+230.4%
Contains
more
Poly. Fat Polyunsaturated fat
+1065.2%
Contains
less
Sat. Fat Saturated fat
-53.4%