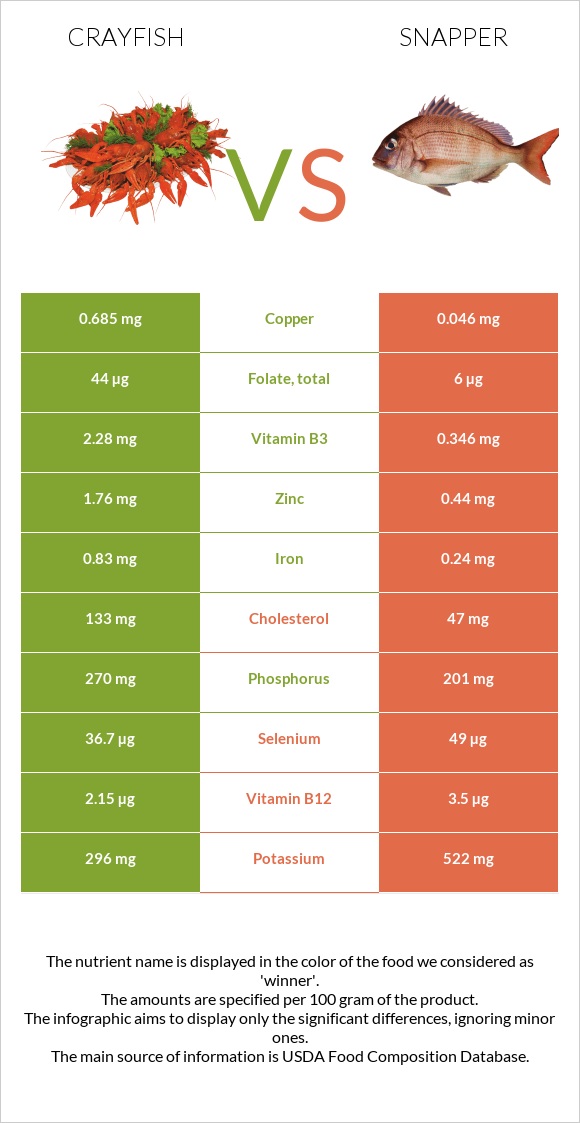
How are crayfish and snapper different? Crayfish is richer in copper, manganese, vitamin B3, zinc, phosphorus, and folate, while snapper is higher in vitamin B12, vitamin B6, and selenium. Crayfish covers your daily need for copper, 71% more than snapper. Crayfish contains 31 times more manganese than snapper. Crayfish contains 0.522mg of manganese, while snapper contains 0.017mg. Snapper is lower in cholesterol. Crustaceans, crayfish, mixed species, wild, cooked, moist heat and Fish, snapper, mixed species, cooked, dry heat types were used in this article.
Infographic
Mineral Comparison
Mineral comparison score is based on the number of minerals by which one or the other food is richer. The "coverage" charts below show how much of the daily needs can be covered by 300 grams of the food.
6
100 g
300 g
3 oz - 85g
Magnesium
Magnesium
Calcium
Calcium
Potassium
Potassium
Iron
Iron
Copper
Copper
Zinc
Zinc
Phosphorus
Phosphorus
Sodium
Sodium
Manganese
Manganese
Selenium
Selenium
24%
18%
26%
31%
228%
48%
116%
12%
68%
200%
4
100 g
300 g
3 oz - 85g 1 fillet - 170g
Magnesium
Magnesium
Calcium
Calcium
Potassium
Potassium
Iron
Iron
Copper
Copper
Zinc
Zinc
Phosphorus
Phosphorus
Sodium
Sodium
Manganese
Manganese
Selenium
Selenium
26%
12%
46%
9%
15%
12%
86%
7.4%
2.2%
267%
Vitamin Comparison
Vitamin comparison score is based on the number of vitamins by which one or the other food is richer. The "coverage" charts below show how much of the daily needs can be covered by 300 grams of the food.
5
100 g
300 g
3 oz - 85g
Vitamin C
Vit. C
Vitamin D
Vit. D
Vitamin A
Vit. A
Vitamin E
Vit. E
Vitamin B1
Vit. B1
Vitamin B2
Vit. B2
Vitamin B3
Vit. B3
Vitamin B5
Vit. B5
Vitamin B6
Vit. B6
Vitamin B12
Vit. B12
Vitamin K
Vit. K
Folate
Folate
3%
0%
5%
30%
13%
20%
43%
35%
18%
269%
0.25%
33%
5
100 g
300 g
3 oz - 85g 1 fillet - 170g
Vitamin C
Vit. C
Vitamin D
Vit. D
Vitamin A
Vit. A
Vitamin E
Vit. E
Vitamin B1
Vit. B1
Vitamin B2
Vit. B2
Vitamin B3
Vit. B3
Vitamin B5
Vit. B5
Vitamin B6
Vit. B6
Vitamin B12
Vit. B12
Vitamin K
Vit. K
Folate
Folate
5.3%
0%
12%
0%
13%
0.92%
6.5%
52%
106%
438%
0%
4.5%
All nutrients comparison - raw data values
Nutrient
DV% diff.
Copper
0.685mg
0.046mg
71%
Vitamin B12
2.15µg
3.5µg
56%
Vitamin B6
0.076mg
0.46mg
30%
Cholesterol
133mg
47mg
29%
Manganese
0.522mg
0.017mg
22%
Selenium
36.7µg
49µg
22%
Protein
16.77g
26.3g
19%
Choline
80.9mg
15%
Zinc
1.76mg
0.44mg
12%
Vitamin B3
2.28mg
0.346mg
12%
Phosphorus
270mg
201mg
10%
Vitamin E
1.5mg
10%
Folate
44µg
6µg
10%
Potassium
296mg
522mg
7%
Iron
0.83mg
0.24mg
7%
Vitamin B2
0.085mg
0.004mg
6%
Vitamin B5
0.58mg
0.87mg
6%
Calories
82kcal
128kcal
2%
Calcium
60mg
40mg
2%
Sodium
94mg
57mg
2%
Vitamin A
15µg
35µg
2%
Fats
1.2g
1.72g
1%
Vitamin C
0.9mg
1.6mg
1%
Magnesium
33mg
37mg
1%
Saturated fat
0.181g
0.365g
1%
Polyunsaturated fat
0.367g
0.588g
1%
Protein per 100 calories
20g
21g
N/A
Calories per 10 g protein
49kcal
49kcal
N/A
Weight per 100 calories
122g
78g
N/A
Vitamin B1
0.05mg
0.053mg
0%
Vitamin K
0.1µg
0%
Monounsaturated fat
0.244g
0.322g
0%
Tryptophan
0.234mg
0.294mg
0%
Threonine
0.676mg
1.153mg
0%
Isoleucine
0.811mg
1.212mg
0%
Leucine
1.329mg
2.137mg
0%
Lysine
1.457mg
2.415mg
0%
Methionine
0.472mg
0.778mg
0%
Phenylalanine
0.706mg
1.027mg
0%
Valine
0.786mg
1.355mg
0%
Histidine
0.341mg
0.774mg
0%
Omega-3 - EPA
0.119g
0.048g
N/A
Omega-3 - DHA
0.047g
0.273g
N/A
Omega-3 - DPA
0g
0.022g
N/A
Macronutrient Comparison
Macronutrient breakdown side-by-side comparison
2
17%
79%
3%
Protein:
16.77 g
Fats:
1.2 g
Carbs:
0 g
Water:
79.37 g
Other:
2.66 g
2
26%
2%
70%
Protein:
26.3 g
Fats:
1.72 g
Carbs:
0 g
Water:
70.35 g
Other:
1.63 g
Contains
more
Water Water
+12.8%
Contains
more
Other Other
+63.2%
Contains
more
Protein Protein
+56.8%
Contains
more
Fats Fats
+43.3%
Fat Type Comparison
Fat type breakdown side-by-side comparison
1
23%
31%
46%
Saturated fat:
Sat. Fat
0.181 g
Monounsaturated fat:
Mono. Fat
0.244 g
Polyunsaturated fat:
Poly. Fat
0.367 g
2
29%
25%
46%
Saturated fat:
Sat. Fat
0.365 g
Monounsaturated fat:
Mono. Fat
0.322 g
Polyunsaturated fat:
Poly. Fat
0.588 g
Contains
less
Sat. Fat Saturated fat
-50.4%
Contains
more
Mono. Fat Monounsaturated fat
+32%
Contains
more
Poly. Fat Polyunsaturated fat
+60.2%