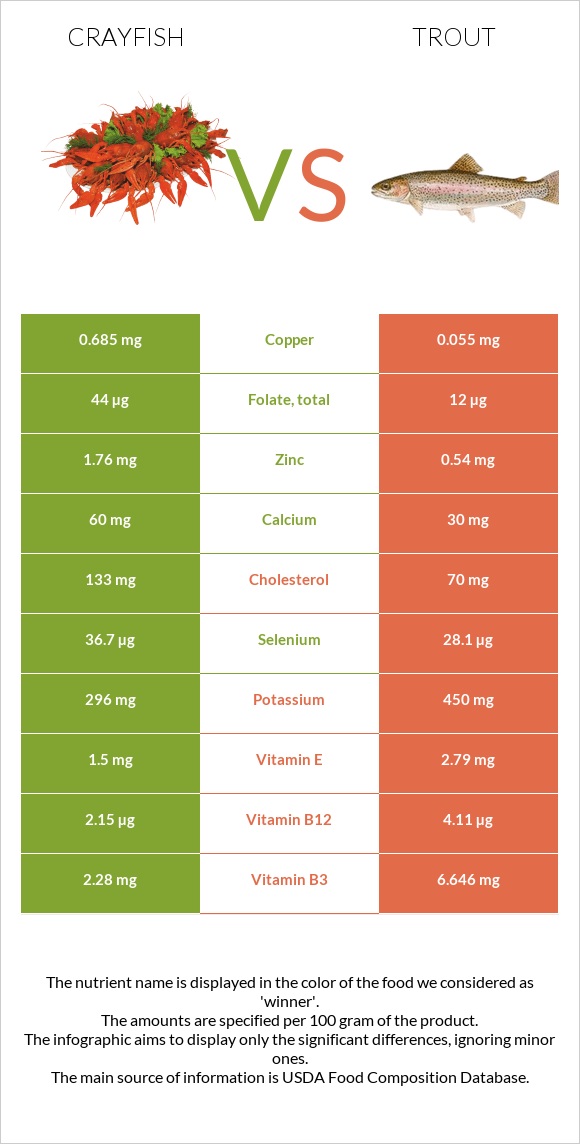
What are the differences between crayfish and trout? Crayfish is higher in copper, manganese, selenium, and zinc, yet trout is higher in vitamin D*, vitamin B12, vitamin B5, vitamin B3, and vitamin B6. Trout's daily need coverage for vitamin D* is 95% more. Crayfish has 40 times more manganese than trout. While crayfish has 0.522mg of manganese, trout has only 0.013mg. The amount of cholesterol in trout is lower. We used Crustaceans, crayfish, mixed species, wild, cooked, moist heat and Fish, trout, rainbow, farmed, cooked, dry heat types in this article.
Infographic
Mineral Comparison
Mineral comparison score is based on the number of minerals by which one or the other food is richer. The "coverage" charts below show how much of the daily needs can be covered by 300 grams of the food.
6
100 g
300 g
3 oz - 85g
Magnesium
Magnesium
Calcium
Calcium
Potassium
Potassium
Iron
Iron
Copper
Copper
Zinc
Zinc
Phosphorus
Phosphorus
Sodium
Sodium
Manganese
Manganese
Selenium
Selenium
24%
18%
26%
31%
228%
48%
116%
12%
68%
200%
2
100 g
300 g
1 fillet - 71g 3 oz - 85g
Magnesium
Magnesium
Calcium
Calcium
Potassium
Potassium
Iron
Iron
Copper
Copper
Zinc
Zinc
Phosphorus
Phosphorus
Sodium
Sodium
Manganese
Manganese
Selenium
Selenium
21%
9%
40%
14%
18%
15%
116%
8%
1.7%
153%
Vitamin Comparison
Vitamin comparison score is based on the number of vitamins by which one or the other food is richer. The "coverage" charts below show how much of the daily needs can be covered by 300 grams of the food.
1
100 g
300 g
3 oz - 85g
Vitamin C
Vit. C
Vitamin D
Vit. D
Vitamin A
Vit. A
Vitamin E
Vit. E
Vitamin B1
Vit. B1
Vitamin B2
Vit. B2
Vitamin B3
Vit. B3
Vitamin B5
Vit. B5
Vitamin B6
Vit. B6
Vitamin B12
Vit. B12
Vitamin K
Vit. K
Folate
Folate
3%
0%
5%
30%
13%
20%
43%
35%
18%
269%
0.25%
33%
10
100 g
300 g
1 fillet - 71g 3 oz - 85g
Vitamin C
Vit. C
Vitamin D
Vit. D
Vitamin A
Vit. A
Vitamin E
Vit. E
Vitamin B1
Vit. B1
Vitamin B2
Vit. B2
Vitamin B3
Vit. B3
Vitamin B5
Vit. B5
Vitamin B6
Vit. B6
Vitamin B12
Vit. B12
Vitamin K
Vit. K
Folate
Folate
9.7%
285%
33%
56%
36%
25%
125%
119%
89%
514%
0.25%
9%
All nutrients comparison - raw data values
Nutrient
DV% diff.
Vitamin D*
0 IU
759 IU
95%
Vitamin D
0µg
19µg
95%
Vitamin B12
2.15µg
4.11µg
82%
Copper
0.685mg
0.055mg
70%
Vitamin B5
0.58mg
1.99mg
28%
Vitamin B3
2.28mg
6.646mg
27%
Vitamin B6
0.076mg
0.386mg
24%
Manganese
0.522mg
0.013mg
22%
Cholesterol
133mg
70mg
21%
Selenium
36.7µg
28.1µg
16%
Protein
16.77g
23.8g
14%
Zinc
1.76mg
0.54mg
11%
Fats
1.2g
7.38g
10%
Polyunsaturated fat
0.367g
1.799g
10%
Vitamin A
15µg
100µg
9%
Vitamin E
1.5mg
2.79mg
9%
Vitamin B1
0.05mg
0.143mg
8%
Folate
44µg
12µg
8%
Saturated fat
0.181g
1.651g
7%
Iron
0.83mg
0.36mg
6%
Potassium
296mg
450mg
5%
Monounsaturated fat
0.244g
2.363g
5%
Calories
82kcal
168kcal
4%
Calcium
60mg
30mg
3%
Vitamin C
0.9mg
2.9mg
2%
Vitamin B2
0.085mg
0.107mg
2%
Magnesium
33mg
30mg
1%
Sodium
94mg
61mg
1%
Choline
80.9mg
77.6mg
1%
Protein per 100 calories
20g
14g
N/A
Calories per 10 g protein
49kcal
71kcal
N/A
Weight per 100 calories
122g
60g
N/A
Unsaturated / Saturated Fat ratio
3.4
2.5
N/A
Phosphorus
270mg
270mg
0%
Vitamin K
0.1µg
0.1µg
0%
Trans fat
0.056g
N/A
Tryptophan
0.234mg
0.279mg
0%
Threonine
0.676mg
1.092mg
0%
Isoleucine
0.811mg
1.148mg
0%
Leucine
1.329mg
2.025mg
0%
Lysine
1.457mg
2.287mg
0%
Methionine
0.472mg
0.738mg
0%
Phenylalanine
0.706mg
0.973mg
0%
Valine
0.786mg
1.283mg
0%
Histidine
0.341mg
0.733mg
0%
Omega-3 - EPA
0.119g
0.259g
N/A
Omega-3 - DHA
0.047g
0.616g
N/A
Omega-3 - DPA
0g
0.109g
N/A
Omega-6 - Eicosadienoic acid
0.047g
N/A
Macronutrient Comparison
Macronutrient breakdown side-by-side comparison
2
17%
79%
3%
Protein:
16.77 g
Fats:
1.2 g
Carbs:
0 g
Water:
79.37 g
Other:
2.66 g
2
24%
7%
69%
Protein:
23.8 g
Fats:
7.38 g
Carbs:
0 g
Water:
68.72 g
Other:
0.1 g
Contains
more
Water Water
+15.5%
Contains
more
Other Other
+2560%
Contains
more
Protein Protein
+41.9%
Contains
more
Fats Fats
+515%
Fat Type Comparison
Fat type breakdown side-by-side comparison
1
23%
31%
46%
Saturated fat:
Sat. Fat
0.181 g
Monounsaturated fat:
Mono. Fat
0.244 g
Polyunsaturated fat:
Poly. Fat
0.367 g
2
28%
41%
31%
Saturated fat:
Sat. Fat
1.651 g
Monounsaturated fat:
Mono. Fat
2.363 g
Polyunsaturated fat:
Poly. Fat
1.799 g
Contains
less
Sat. Fat Saturated fat
-89%
Contains
more
Mono. Fat Monounsaturated fat
+868.4%
Contains
more
Poly. Fat Polyunsaturated fat
+390.2%