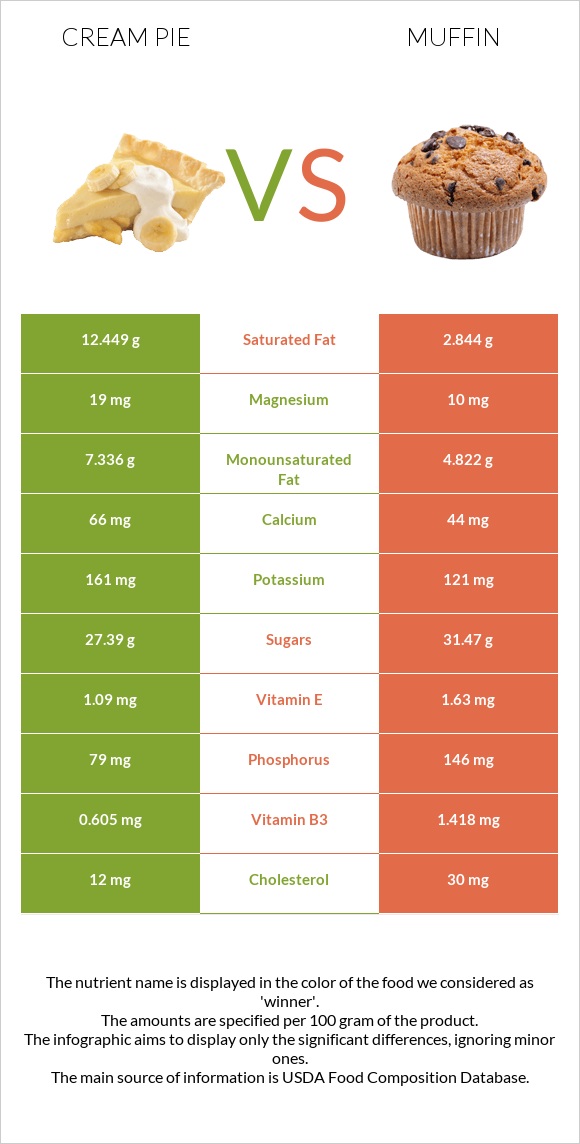
The main differences between cream pie and muffin Cream pie has more copper; however, muffin has more vitamin K, choline, manganese, phosphorus, folate, vitamin B1, and vitamin B3. Daily need coverage for saturated fat for cream pie is 48% higher. Muffin has 2 times less copper than cream pie. Cream pie has 0.118mg of copper, while muffin has 0.06mg. Muffin is lower in saturated fat. Food types used in this article are Pie, chocolate creme, commercially prepared and Muffins, blueberry, commercially prepared (Includes mini-muffins) .
Infographic
Mineral Comparison
Mineral comparison score is based on the number of minerals by which one or the other food is richer. The "coverage" charts below show how much of the daily needs can be covered by 300 grams of the food.
7
100 g
300 g
1 oz - 28.35g 1 piece (1/4 of 6" pie) - 99g 1 piece (1/6 of 8" pie) - 113g 1 serving .167 pie - 120g
Magnesium
Magnesium
Calcium
Calcium
Potassium
Potassium
Iron
Iron
Copper
Copper
Zinc
Zinc
Phosphorus
Phosphorus
Sodium
Sodium
Manganese
Manganese
Selenium
Selenium
14%
20%
14%
56%
39%
12%
34%
35%
21%
33%
3
100 g
300 g
1 mini (1-1/4" dia) - 17g 1 oz - 28.35g 1 muffin - 31g 1 small (2-3/4" dia x 2") - 66g 1 medium - 113g 1 large (3-1/4" dia x 2-3/4") - 139g 1 extra large - 168g
Magnesium
Magnesium
Calcium
Calcium
Potassium
Potassium
Iron
Iron
Copper
Copper
Zinc
Zinc
Phosphorus
Phosphorus
Sodium
Sodium
Manganese
Manganese
Selenium
Selenium
7.1%
13%
11%
49%
20%
10%
63%
44%
59%
45%
Vitamin Comparison
Vitamin comparison score is based on the number of vitamins by which one or the other food is richer. The "coverage" charts below show how much of the daily needs can be covered by 300 grams of the food.
1
100 g
300 g
1 oz - 28.35g 1 piece (1/4 of 6" pie) - 99g 1 piece (1/6 of 8" pie) - 113g 1 serving .167 pie - 120g
Vitamin C
Vit. C
Vitamin D
Vit. D
Vitamin A
Vit. A
Vitamin E
Vit. E
Vitamin B1
Vit. B1
Vitamin B2
Vit. B2
Vitamin B3
Vit. B3
Vitamin B5
Vit. B5
Vitamin B6
Vit. B6
Vitamin B12
Vit. B12
Vitamin K
Vit. K
Folate
Folate
0%
1.5%
15%
22%
22%
32%
11%
14%
4.6%
15%
24%
14%
10
100 g
300 g
1 mini (1-1/4" dia) - 17g 1 oz - 28.35g 1 muffin - 31g 1 small (2-3/4" dia x 2") - 66g 1 medium - 113g 1 large (3-1/4" dia x 2-3/4") - 139g 1 extra large - 168g
Vitamin C
Vit. C
Vitamin D
Vit. D
Vitamin A
Vit. A
Vitamin E
Vit. E
Vitamin B1
Vit. B1
Vitamin B2
Vit. B2
Vitamin B3
Vit. B3
Vitamin B5
Vit. B5
Vitamin B6
Vit. B6
Vitamin B12
Vit. B12
Vitamin K
Vit. K
Folate
Folate
3%
1.5%
7%
33%
42%
38%
27%
28%
9.2%
20%
98%
36%
All nutrients comparison - raw data values
Nutrient
DV% diff.
Polyunsaturated fat
1.149g
8.103g
46%
Saturated fat
12.449g
2.844g
44%
Vitamin K
9.5µg
39.2µg
25%
Choline
17.9mg
92.5mg
14%
Manganese
0.161mg
0.449mg
13%
Fats
22.41g
16.07g
10%
Phosphorus
79mg
146mg
10%
Starch
16.31g
7%
Vitamin B1
0.087mg
0.168mg
7%
Folate
19µg
48µg
7%
Cholesterol
12mg
30mg
6%
Copper
0.118mg
0.06mg
6%
Monounsaturated fat
7.336g
4.822g
6%
Carbs
38.44g
53g
5%
Vitamin B3
0.605mg
1.418mg
5%
Vitamin B5
0.232mg
0.47mg
5%
Vitamin E
1.09mg
1.63mg
4%
Selenium
6µg
8.2µg
4%
Sodium
266mg
336mg
3%
Vitamin A
46µg
21µg
3%
Magnesium
19mg
10mg
2%
Calcium
66mg
44mg
2%
Iron
1.49mg
1.3mg
2%
Vitamin B2
0.14mg
0.163mg
2%
Vitamin B6
0.02mg
0.04mg
2%
Vitamin B12
0.12µg
0.16µg
2%
Fructose
1.21g
2%
Calories
353kcal
375kcal
1%
Protein
4.15g
4.49g
1%
Vitamin C
0mg
0.9mg
1%
Potassium
161mg
121mg
1%
Fiber
0.8g
1.1g
1%
Zinc
0.44mg
0.37mg
1%
Protein per 100 calories
1.2g
1.2g
N/A
Calories per 10 g protein
851kcal
835kcal
N/A
Weight per 100 calories
28g
27g
N/A
Unsaturated / Saturated Fat ratio
0.68
4.5
N/A
Net carbs
37.64g
51.9g
N/A
Vitamin D*
3 IU
4 IU
0%
Vitamin D
0.1µg
0.1µg
0%
Sugar
27.39g
31.47g
N/A
Trans fat
2.49g
0.2g
N/A
Tryptophan
0.066mg
0%
Threonine
0.181mg
0%
Isoleucine
0.224mg
0%
Leucine
0.421mg
0%
Lysine
0.199mg
0%
Methionine
0.115mg
0%
Phenylalanine
0.277mg
0%
Valine
0.257mg
0%
Histidine
0.128mg
0%
Omega-3 - EPA
0.001g
0g
N/A
Omega-3 - DHA
0g
0.008g
N/A
Omega-3 - ALA
1.022g
N/A
Omega-3 - DPA
0g
0.001g
N/A
Omega-6 - Gamma-linoleic acid
0.048g
N/A
Omega-6 - Dihomo-gamma-linoleic acid
0.002g
N/A
Omega-6 - Eicosadienoic acid
0g
0.007g
N/A
Omega-6 - Linoleic acid
6.911g
N/A
Macronutrient Comparison
Macronutrient breakdown side-by-side comparison
2
4%
22%
38%
34%
Protein:
4.15 g
Fats:
22.41 g
Carbs:
38.44 g
Water:
33.92 g
Other:
1.08 g
3
4%
16%
53%
25%
Protein:
4.49 g
Fats:
16.07 g
Carbs:
53 g
Water:
24.96 g
Other:
1.48 g
Contains
more
Fats Fats
+39.5%
Contains
more
Water Water
+35.9%
Contains
more
Carbs Carbs
+37.9%
Contains
more
Other Other
+37%
Fat Type Comparison
Fat type breakdown side-by-side comparison
1
59%
35%
5%
Saturated fat:
Sat. Fat
12.449 g
Monounsaturated fat:
Mono. Fat
7.336 g
Polyunsaturated fat:
Poly. Fat
1.149 g
2
18%
31%
51%
Saturated fat:
Sat. Fat
2.844 g
Monounsaturated fat:
Mono. Fat
4.822 g
Polyunsaturated fat:
Poly. Fat
8.103 g
Contains
more
Mono. Fat Monounsaturated fat
+52.1%
Contains
less
Sat. Fat Saturated fat
-77.2%
Contains
more
Poly. Fat Polyunsaturated fat
+605.2%