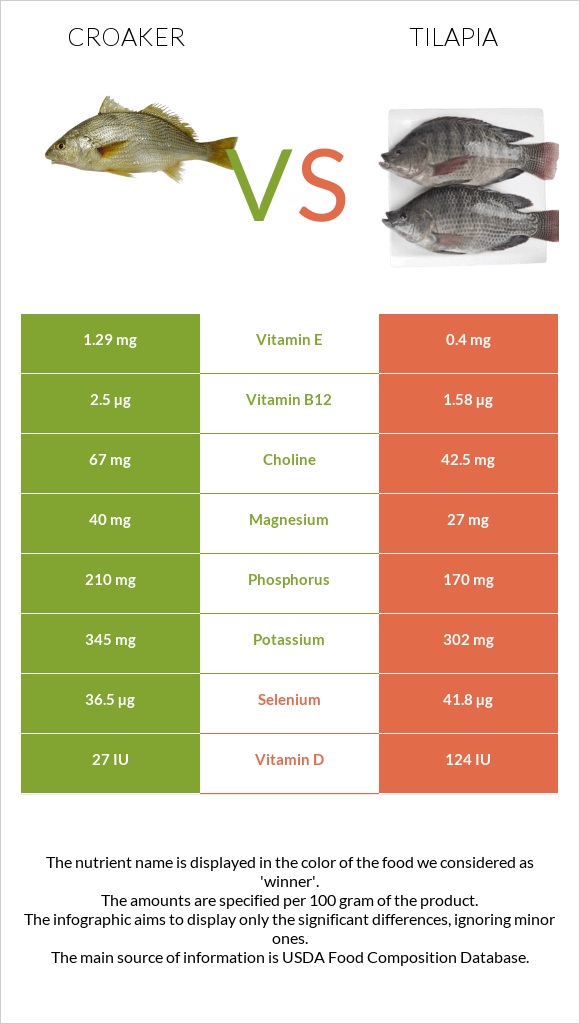
Summary of differences between croaker and tilapia Croaker has more vitamin B6, vitamin B12, folate, and polyunsaturated fat, while tilapia has more selenium. Tilapia covers your daily need for selenium, 28% more than croaker. Croaker contains 6 times more sodium than tilapia. While croaker contains 348mg of sodium, tilapia contains only 56mg. These are the specific foods used in this comparison Fish, croaker, Atlantic, cooked, breaded, and fried and Fish, tilapia, cooked, dry heat .
Infographic
Mineral Comparison
Mineral comparison score is based on the number of minerals by which one or the other food is richer. The "coverage" charts below show how much of the daily needs can be covered by 300 grams of the food.
5
100 g
300 g
3 oz - 85g 1 fillet - 87g
Magnesium
Magnesium
Calcium
Calcium
Potassium
Potassium
Iron
Iron
Copper
Copper
Zinc
Zinc
Phosphorus
Phosphorus
Sodium
Sodium
Manganese
Manganese
Selenium
Selenium
30%
9.6%
30%
32%
22%
14%
93%
45%
10%
212%
4
100 g
300 g
1 fillet - 87g
Magnesium
Magnesium
Calcium
Calcium
Potassium
Potassium
Iron
Iron
Copper
Copper
Zinc
Zinc
Phosphorus
Phosphorus
Sodium
Sodium
Manganese
Manganese
Selenium
Selenium
24%
4.2%
34%
26%
25%
11%
87%
7.3%
4.8%
297%
Vitamin Comparison
Vitamin comparison score is based on the number of vitamins by which one or the other food is richer. The "coverage" charts below show how much of the daily needs can be covered by 300 grams of the food.
6
100 g
300 g
3 oz - 85g 1 fillet - 87g
Vitamin C
Vit. C
Vitamin D
Vit. D
Vitamin A
Vit. A
Vitamin E
Vit. E
Vitamin B1
Vit. B1
Vitamin B2
Vit. B2
Vitamin B3
Vit. B3
Vitamin B5
Vit. B5
Vitamin B6
Vit. B6
Vitamin B12
Vit. B12
Vitamin K
Vit. K
Folate
Folate
0%
0%
7.7%
0%
23%
30%
81%
44%
60%
263%
0%
26%
4
100 g
300 g
1 fillet - 87g
Vitamin C
Vit. C
Vitamin D
Vit. D
Vitamin A
Vit. A
Vitamin E
Vit. E
Vitamin B1
Vit. B1
Vitamin B2
Vit. B2
Vitamin B3
Vit. B3
Vitamin B5
Vit. B5
Vitamin B6
Vit. B6
Vitamin B12
Vit. B12
Vitamin K
Vit. K
Folate
Folate
0%
56%
0%
16%
23%
17%
89%
40%
28%
233%
2.3%
4.5%
All nutrients comparison - raw data values
Nutrient
DV% diff.
Selenium
38.8µg
54.4µg
28%
Vitamin D*
150 IU
19%
Vitamin D
3.7µg
19%
Protein
18.2g
26.15g
16%
Fats
12.67g
2.65g
15%
Polyunsaturated fat
2.917g
0.6g
15%
Sodium
348mg
56mg
13%
Saturated fat
3.476g
0.94g
12%
Vitamin B6
0.26mg
0.123mg
11%
Monounsaturated fat
5.32g
0.955g
11%
Vitamin B12
2.1µg
1.86µg
10%
Cholesterol
84mg
57mg
9%
Choline
51.3mg
9%
Folate
34µg
6µg
7%
Calories
221kcal
128kcal
5%
Vitamin E
0.79mg
5%
Vitamin B2
0.13mg
0.073mg
4%
Carbs
7.54g
0g
3%
Vitamin A
23µg
0µg
3%
Vitamin B3
4.3mg
4.745mg
3%
Magnesium
42mg
34mg
2%
Calcium
32mg
14mg
2%
Iron
0.86mg
0.69mg
2%
Fiber
0.4g
0g
2%
Phosphorus
217mg
204mg
2%
Manganese
0.08mg
0.037mg
2%
Vitamin B5
0.74mg
0.664mg
2%
Potassium
340mg
380mg
1%
Copper
0.065mg
0.075mg
1%
Zinc
0.52mg
0.41mg
1%
Vitamin K
0.9µg
1%
Protein per 100 calories
8.2g
20g
N/A
Calories per 10 g protein
121kcal
49kcal
N/A
Weight per 100 calories
45g
78g
N/A
Unsaturated / Saturated Fat ratio
2.4
1.7
N/A
Net carbs
7.14g
0g
N/A
Vitamin B1
0.09mg
0.093mg
0%
Tryptophan
0.208mg
0.265mg
0%
Threonine
0.788mg
1.156mg
0%
Isoleucine
0.847mg
1.22mg
0%
Leucine
1.48mg
2.04mg
0%
Lysine
1.571mg
2.315mg
0%
Methionine
0.525mg
0.766mg
0%
Phenylalanine
0.742mg
1.05mg
0%
Valine
0.947mg
1.28mg
0%
Histidine
0.525mg
0.585mg
0%
Omega-3 - EPA
0.113g
0.005g
N/A
Omega-3 - DHA
0.089g
0.13g
N/A
Omega-3 - ALA
0.045g
N/A
Omega-3 - DPA
0.079g
0.06g
N/A
Omega-6 - Eicosadienoic acid
0.015g
N/A
Macronutrient Comparison
Macronutrient breakdown side-by-side comparison
3
18%
13%
8%
60%
2%
Protein:
18.2 g
Fats:
12.67 g
Carbs:
7.54 g
Water:
59.76 g
Other:
1.83 g
2
26%
3%
71%
Protein:
26.15 g
Fats:
2.65 g
Carbs:
0 g
Water:
71.59 g
Other:
0 g
Contains
more
Fats Fats
+378.1%
Contains
more
Carbs Carbs
+∞%
Contains
more
Other Other
+∞%
Contains
more
Protein Protein
+43.7%
Contains
more
Water Water
+19.8%
Fat Type Comparison
Fat type breakdown side-by-side comparison
2
30%
45%
25%
Saturated fat:
Sat. Fat
3.476 g
Monounsaturated fat:
Mono. Fat
5.32 g
Polyunsaturated fat:
Poly. Fat
2.917 g
1
38%
38%
24%
Saturated fat:
Sat. Fat
0.94 g
Monounsaturated fat:
Mono. Fat
0.955 g
Polyunsaturated fat:
Poly. Fat
0.6 g
Contains
more
Mono. Fat Monounsaturated fat
+457.1%
Contains
more
Poly. Fat Polyunsaturated fat
+386.2%
Contains
less
Sat. Fat Saturated fat
-73%