Crunch bar vs. Apricot jam — In-Depth Nutrition Comparison
Compare
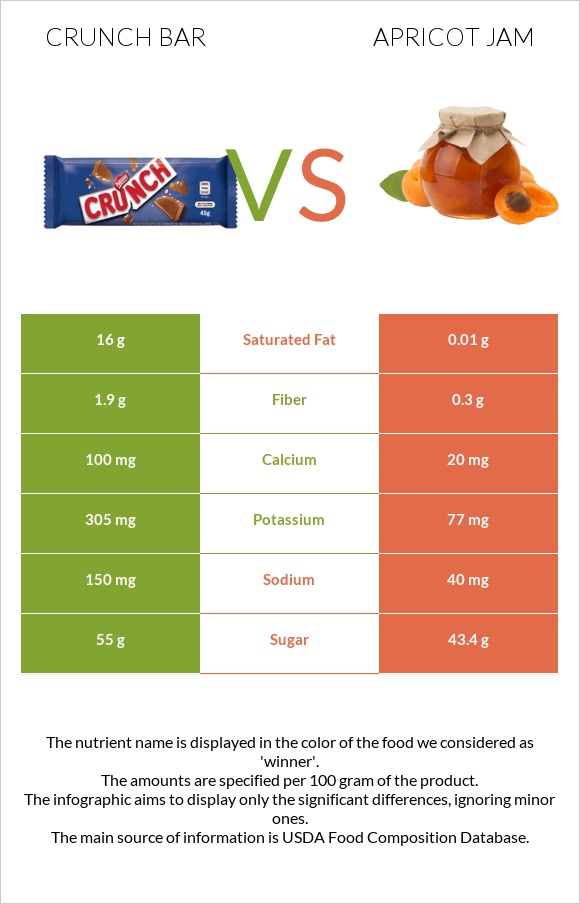
The main differences between crunch bar and apricot jam
- Crunch bar is richer in calcium, potassium, and fiber, yet apricot jam is richer in vitamin C.
- Daily need coverage for saturated fat for crunch bar is 80% higher.
- Crunch bar contains 6 times more fiber than apricot jam. Crunch bar contains 1.9g of fiber, while apricot jam contains 0.3g.
- Apricot jam contains less saturated fat.
Food types used in this article are Candies, NESTLE, CRUNCH Bar, and Dessert Topping and Jams and preserves, apricot.
Infographic
Infographic link
Mineral Comparison
Mineral comparison score is based on the number of minerals by which one or the other food is richer. The "coverage" charts below show how much of the daily needs can be covered by 300 grams of the food.
| Contains more CalciumCalcium | +400% |
| Contains more PotassiumPotassium | +296.1% |
| Contains more IronIron | +42.9% |
| Contains less SodiumSodium | -73.3% |
Vitamin Comparison
Vitamin comparison score is based on the number of vitamins by which one or the other food is richer. The "coverage" charts below show how much of the daily needs can be covered by 300 grams of the food.
| Contains more Vitamin CVitamin C | +1660% |
All nutrients comparison - raw data values
| Nutrient |  |
 |
DV% diff. |
| Saturated fat | 16g | 0.01g | 73% |
| Fats | 26g | 0.2g | 40% |
| Calories | 500kcal | 242kcal | 13% |
| Copper | 0.1mg | 11% | |
| Protein | 5g | 0.7g | 9% |
| Vitamin C | 0.5mg | 8.8mg | 9% |
| Calcium | 100mg | 20mg | 8% |
| Caffeine | 30mg | 0mg | 8% |
| Potassium | 305mg | 77mg | 7% |
| Fiber | 1.9g | 0.3g | 6% |
| Sodium | 150mg | 40mg | 5% |
| Cholesterol | 13mg | 0mg | 4% |
| Selenium | 2µg | 4% | |
| Iron | 0.7mg | 0.49mg | 3% |
| Manganese | 0.04mg | 2% | |
| Vitamin B2 | 0.022mg | 2% | |
| Vitamin B6 | 0.02mg | 2% | |
| Carbs | 67g | 64.4g | 1% |
| Magnesium | 4mg | 1% | |
| Zinc | 0.06mg | 1% | |
| Vitamin A | 10µg | 1% | |
| Vitamin E | 0.13mg | 1% | |
| Weight per 100 calories | 20g | 41g | N/A |
| Net carbs | 65.1g | 64.1g | N/A |
| Sugar | 55g | 43.4g | N/A |
| Phosphorus | 3mg | 0% | |
| Vitamin B3 | 0.036mg | 0% | |
| Vitamin B5 | 0.02mg | 0% | |
| Folate | 1µg | 0% | |
| Trans fat | 0.137g | N/A | |
| Choline | 0.4mg | 0% |
Macronutrient Comparison
Macronutrient breakdown side-by-side comparison
Protein:
5 g
Fats:
26 g
Carbs:
67 g
Water:
0.65 g
Other:
1.35 g
Protein:
0.7 g
Fats:
0.2 g
Carbs:
64.4 g
Water:
34.5 g
Other:
0.2 g
| Contains more ProteinProtein | +614.3% |
| Contains more FatsFats | +12900% |
| Contains more OtherOther | +575% |
| Contains more WaterWater | +5207.7% |
~equal in
Carbs
~64.4g
Fat Type Comparison
Fat type breakdown side-by-side comparison
Saturated fat:
Sat. Fat
16 g
Monounsaturated fat:
Mono. Fat
0 g
Polyunsaturated fat:
Poly. Fat
0 g
Saturated fat:
Sat. Fat
0.01 g
Monounsaturated fat:
Mono. Fat
0 g
Polyunsaturated fat:
Poly. Fat
0 g
| Contains less Sat. FatSaturated fat | -99.9% |
~equal in
Monounsaturated fat
~0g
~equal in
Polyunsaturated fat
~0g


