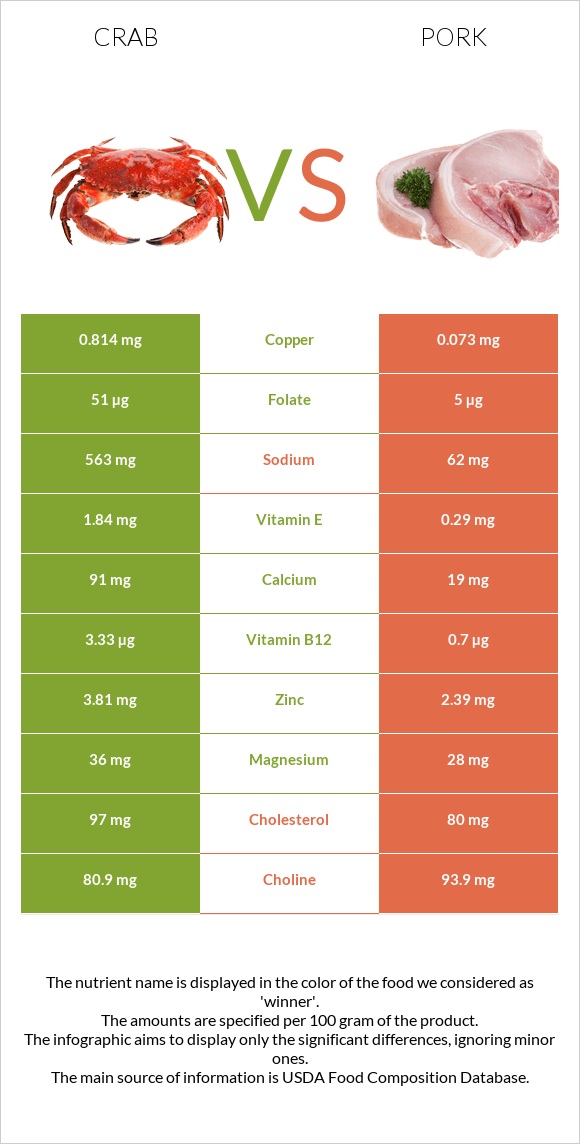
Summary of differences between crab and pork Crab has more vitamin B12, copper, zinc, and folate, while pork has more vitamin B1, vitamin B6, vitamin B2, and vitamin B3. Crab covers your daily need for vitamin B12, 110% more than pork. Crab contains 11 times more copper than pork. While crab contains 0.814mg of copper, pork contains only 0.073mg. The amount of sodium in pork is lower. These are the specific foods used in this comparison Crustaceans, crab, blue, canned and Pork, fresh, loin, whole, separable lean, and fat, cooked, broiled .
Infographic
Mineral Comparison
Mineral comparison score is based on the number of minerals by which one or the other food is richer. The "coverage" charts below show how much of the daily needs can be covered by 300 grams of the food.
5
100 g
300 g
1 oz - 28.35g 3 oz - 85g 1 can (6.5 oz), drained - 125g 1 cup - 135g
Magnesium
Magnesium
Calcium
Calcium
Potassium
Potassium
Iron
Iron
Copper
Copper
Zinc
Zinc
Phosphorus
Phosphorus
Sodium
Sodium
Manganese
Manganese
Selenium
Selenium
26%
27%
23%
19%
271%
104%
100%
73%
9.7%
234%
3
100 g
300 g
3 oz - 85g 1 chop, excluding refuse (yield from 1 raw chop, with refuse, weighing 151 g) - 87g
Magnesium
Magnesium
Calcium
Calcium
Potassium
Potassium
Iron
Iron
Copper
Copper
Zinc
Zinc
Phosphorus
Phosphorus
Sodium
Sodium
Manganese
Manganese
Selenium
Selenium
20%
5.7%
37%
33%
24%
65%
105%
8.1%
1.2%
247%
Vitamin Comparison
Vitamin comparison score is based on the number of vitamins by which one or the other food is richer. The "coverage" charts below show how much of the daily needs can be covered by 300 grams of the food.
6
100 g
300 g
1 oz - 28.35g 3 oz - 85g 1 can (6.5 oz), drained - 125g 1 cup - 135g
Vitamin C
Vit. C
Vitamin D
Vit. D
Vitamin A
Vit. A
Vitamin E
Vit. E
Vitamin B1
Vit. B1
Vitamin B2
Vit. B2
Vitamin B3
Vit. B3
Vitamin B5
Vit. B5
Vitamin B6
Vit. B6
Vitamin B12
Vit. B12
Vitamin K
Vit. K
Folate
Folate
11%
0%
0.33%
37%
5.8%
21%
52%
60%
36%
416%
0.75%
38%
6
100 g
300 g
3 oz - 85g 1 chop, excluding refuse (yield from 1 raw chop, with refuse, weighing 151 g) - 87g
Vitamin C
Vit. C
Vitamin D
Vit. D
Vitamin A
Vit. A
Vitamin E
Vit. E
Vitamin B1
Vit. B1
Vitamin B2
Vit. B2
Vitamin B3
Vit. B3
Vitamin B5
Vit. B5
Vitamin B6
Vit. B6
Vitamin B12
Vit. B12
Vitamin K
Vit. K
Folate
Folate
2%
20%
0.67%
5.8%
219%
74%
94%
42%
107%
88%
0%
3.8%
All nutrients comparison - raw data values
Nutrient
DV% diff.
Vitamin B12
3.33µg
0.7µg
110%
Copper
0.814mg
0.073mg
82%
Vitamin B1
0.023mg
0.877mg
71%
Vitamin B6
0.156mg
0.464mg
24%
Saturated fat
0.201g
5.23g
23%
Sodium
563mg
62mg
22%
Fats
0.74g
13.92g
20%
Protein
17.88g
27.32g
19%
Vitamin B2
0.093mg
0.321mg
18%
Monounsaturated fat
0.129g
6.19g
15%
Vitamin B3
2.747mg
5.037mg
14%
Zinc
3.81mg
2.39mg
13%
Folate
51µg
5µg
12%
Vitamin E
1.84mg
0.29mg
10%
Calories
83kcal
242kcal
8%
Vitamin D*
0 IU
53 IU
7%
Vitamin D
0µg
1.3µg
7%
Calcium
91mg
19mg
7%
Cholesterol
97mg
80mg
6%
Vitamin B5
0.997mg
0.698mg
6%
Polyunsaturated fat
0.258g
1.2g
6%
Potassium
259mg
423mg
5%
Iron
0.5mg
0.87mg
5%
Selenium
42.9µg
45.3µg
4%
Vitamin C
3.3mg
0.6mg
3%
Manganese
0.074mg
0.009mg
3%
Magnesium
36mg
28mg
2%
Phosphorus
234mg
246mg
2%
Choline
80.9mg
93.9mg
2%
Protein per 100 calories
22g
11g
N/A
Calories per 10 g protein
46kcal
89kcal
N/A
Weight per 100 calories
120g
41g
N/A
Unsaturated / Saturated Fat ratio
1.9
1.4
N/A
Vitamin A
1µg
2µg
0%
Vitamin K
0.3µg
0µg
0%
Trans fat
0.014g
N/A
Tryptophan
0.226mg
0.338mg
0%
Threonine
0.727mg
1.234mg
0%
Isoleucine
0.776mg
1.26mg
0%
Leucine
1.307mg
2.177mg
0%
Lysine
1.386mg
2.446mg
0%
Methionine
0.452mg
0.712mg
0%
Phenylalanine
0.708mg
1.086mg
0%
Valine
0.806mg
1.473mg
0%
Histidine
0.393mg
1.067mg
0%
Omega-3 - EPA
0.101g
0g
N/A
Omega-3 - DHA
0.067g
0g
N/A
Omega-3 - DPA
0.009g
0g
N/A
Omega-6 - Eicosadienoic acid
0.005g
N/A
Macronutrient Comparison
Macronutrient breakdown side-by-side comparison
2
18%
80%
2%
Protein:
17.88 g
Fats:
0.74 g
Carbs:
0 g
Water:
79.69 g
Other:
1.69 g
2
27%
14%
58%
Protein:
27.32 g
Fats:
13.92 g
Carbs:
0 g
Water:
57.87 g
Other:
0.89 g
Contains
more
Water Water
+37.7%
Contains
more
Other Other
+89.9%
Contains
more
Protein Protein
+52.8%
Contains
more
Fats Fats
+1781.1%
Fat Type Comparison
Fat type breakdown side-by-side comparison
1
34%
22%
44%
Saturated fat:
Sat. Fat
0.201 g
Monounsaturated fat:
Mono. Fat
0.129 g
Polyunsaturated fat:
Poly. Fat
0.258 g
2
41%
49%
10%
Saturated fat:
Sat. Fat
5.23 g
Monounsaturated fat:
Mono. Fat
6.19 g
Polyunsaturated fat:
Poly. Fat
1.2 g
Contains
less
Sat. Fat Saturated fat
-96.2%
Contains
more
Mono. Fat Monounsaturated fat
+4698.4%
Contains
more
Poly. Fat Polyunsaturated fat
+365.1%