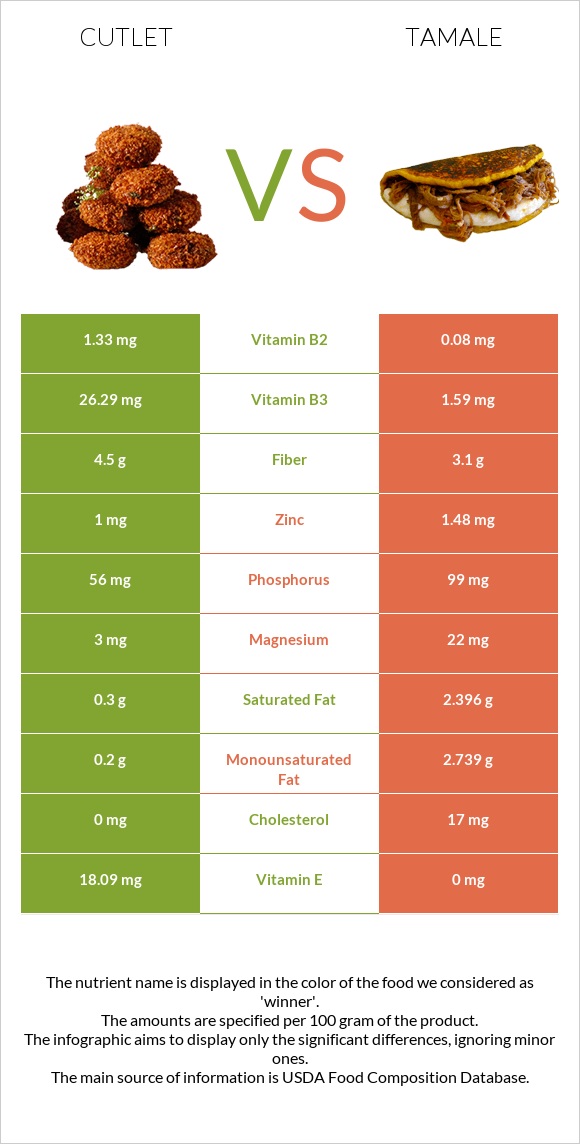
Summary of differences between cutlet and tamale Cutlet has more vitamin B3, vitamin E, vitamin B2, vitamin B6, iron, and fiber; however, tamale is higher in vitamin B12 and phosphorus. Cutlet covers your daily need for vitamin B3, 154% more than tamale. Cutlet has less saturated fat. The glycemic index of tamale is higher. These are the specific foods used in this comparison WORTHINGTON Multigrain Cutlets, canned, unprepared and Tamales (Navajo) .
Infographic
Mineral Comparison
Mineral comparison score is based on the number of minerals by which one or the other food is richer. The "coverage" charts below show how much of the daily needs can be covered by 300 grams of the food.
2
100 g
300 g
2 slices - 92g
Magnesium
Magnesium
Calcium
Calcium
Potassium
Potassium
Iron
Iron
Copper
Copper
Zinc
Zinc
Phosphorus
Phosphorus
Sodium
Sodium
Manganese
Manganese
Selenium
Selenium
2.1%
6.6%
9.3%
64%
0%
27%
24%
48%
0%
0%
8
100 g
300 g
1 piece - 186g
Magnesium
Magnesium
Calcium
Calcium
Potassium
Potassium
Iron
Iron
Copper
Copper
Zinc
Zinc
Phosphorus
Phosphorus
Sodium
Sodium
Manganese
Manganese
Selenium
Selenium
16%
8.7%
12%
46%
21%
40%
42%
56%
23%
33%
Vitamin Comparison
Vitamin comparison score is based on the number of vitamins by which one or the other food is richer. The "coverage" charts below show how much of the daily needs can be covered by 300 grams of the food.
4
100 g
300 g
2 slices - 92g
Vitamin C
Vit. C
Vitamin D
Vit. D
Vitamin A
Vit. A
Vitamin E
Vit. E
Vitamin B1
Vit. B1
Vitamin B2
Vit. B2
Vitamin B3
Vit. B3
Vitamin B5
Vit. B5
Vitamin B6
Vit. B6
Vitamin B12
Vit. B12
Vitamin K
Vit. K
Folate
Folate
0%
0%
0%
362%
13%
307%
493%
0%
115%
0%
0%
1.5%
4
100 g
300 g
1 piece - 186g
Vitamin C
Vit. C
Vitamin D
Vit. D
Vitamin A
Vit. A
Vitamin E
Vit. E
Vitamin B1
Vit. B1
Vitamin B2
Vit. B2
Vitamin B3
Vit. B3
Vitamin B5
Vit. B5
Vitamin B6
Vit. B6
Vitamin B12
Vit. B12
Vitamin K
Vit. K
Folate
Folate
5.7%
0%
0%
0%
13%
18%
30%
12%
33%
68%
0%
11%
All nutrients comparison - raw data values
Nutrient
DV% diff.
Vitamin B3
26.29mg
1.59mg
154%
Vitamin E
18.09mg
0mg
121%
Vitamin B2
1.33mg
0.08mg
96%
Protein
23.29g
6.28g
34%
Vitamin B6
0.5mg
0.143mg
27%
Vitamin B12
0µg
0.54µg
23%
Selenium
6µg
11%
Saturated fat
0.3g
2.396g
10%
Manganese
0.174mg
8%
Fats
1.5g
6.12g
7%
Copper
0.063mg
7%
Cholesterol
0mg
17mg
6%
Iron
1.7mg
1.22mg
6%
Fiber
4.5g
3.1g
6%
Phosphorus
56mg
99mg
6%
Monounsaturated fat
0.2g
2.739g
6%
Magnesium
3mg
22mg
5%
Starch
12.27g
5%
Carbs
7.3g
18.12g
4%
Zinc
1mg
1.48mg
4%
Vitamin B5
0.205mg
4%
Folate
2µg
15µg
3%
Calories
117kcal
153kcal
2%
Vitamin C
0mg
1.7mg
2%
Sodium
371mg
427mg
2%
Calcium
22mg
29mg
1%
Potassium
105mg
131mg
1%
Polyunsaturated fat
0.8g
0.688g
1%
Protein per 100 calories
20g
4.1g
N/A
Calories per 10 g protein
50kcal
244kcal
N/A
Weight per 100 calories
85g
65g
N/A
Unsaturated / Saturated Fat ratio
3.3
1.4
N/A
Net carbs
2.8g
15.02g
N/A
Sugar
0.2g
0.99g
N/A
Vitamin B1
0.05mg
0.05mg
0%
Tryptophan
0.052mg
0%
Threonine
0.239mg
0%
Isoleucine
0.271mg
0%
Leucine
0.568mg
0%
Lysine
0.427mg
0%
Methionine
0.15mg
0%
Phenylalanine
0.275mg
0%
Valine
0.318mg
0%
Histidine
0.196mg
0%
Fructose
0.17g
0%
Omega-3 - ALA
0.029g
N/A
Macronutrient Comparison
Macronutrient breakdown side-by-side comparison
1
23%
7%
67%
Protein:
23.29 g
Fats:
1.5 g
Carbs:
7.3 g
Water:
66.69 g
Other:
1.22 g
4
6%
6%
18%
68%
Protein:
6.28 g
Fats:
6.12 g
Carbs:
18.12 g
Water:
68.1 g
Other:
1.38 g
Contains
more
Protein Protein
+270.9%
Contains
more
Fats Fats
+308%
Contains
more
Carbs Carbs
+148.2%
Contains
more
Other Other
+13.1%
Fat Type Comparison
Fat type breakdown side-by-side comparison
2
23%
15%
62%
Saturated fat:
Sat. Fat
0.3 g
Monounsaturated fat:
Mono. Fat
0.2 g
Polyunsaturated fat:
Poly. Fat
0.8 g
1
41%
47%
12%
Saturated fat:
Sat. Fat
2.396 g
Monounsaturated fat:
Mono. Fat
2.739 g
Polyunsaturated fat:
Poly. Fat
0.688 g
Contains
less
Sat. Fat Saturated fat
-87.5%
Contains
more
Poly. Fat Polyunsaturated fat
+16.3%
Contains
more
Mono. Fat Monounsaturated fat
+1269.5%