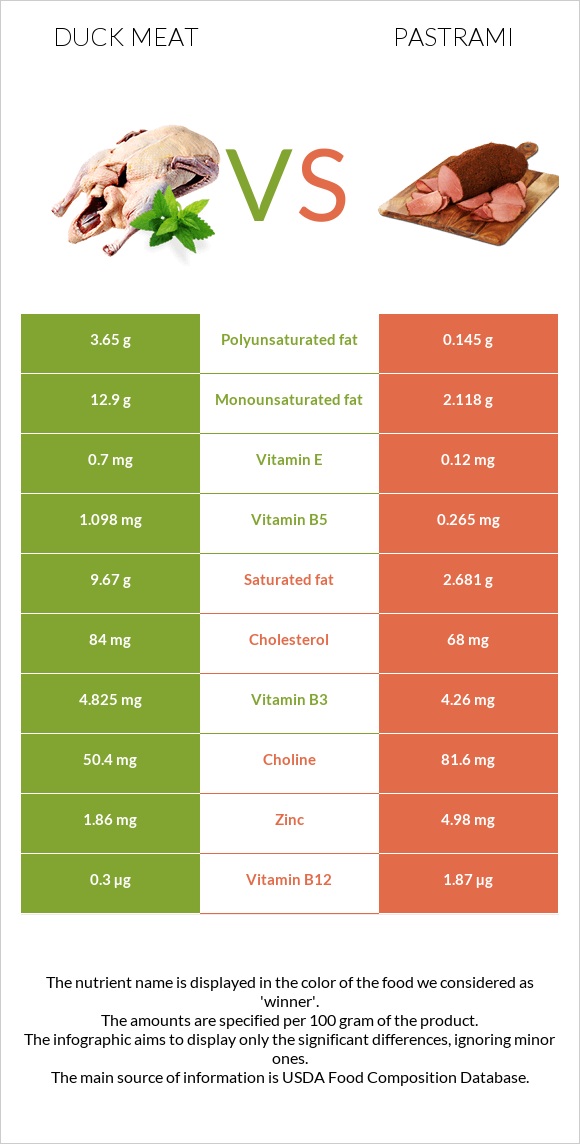
A recap on the differences between duck meat and pastrami Duck meat has more vitamin B5, copper, vitamin B1, vitamin B2, and iron; however, pastrami is higher in vitamin B12, zinc, and choline. Pastrami covers your daily vitamin B12 needs 65% more than duck meat. Pastrami contains 4 times less vitamin B5 than duck meat. Duck meat contains 1.098mg of vitamin B5, while pastrami contains 0.265mg. Pastrami has less saturated fat. The glycemic index of pastrami is higher. Food varieties used in this article are Duck, domesticated, meat, and skin, cooked, roasted and Beef, cured, pastrami .
Infographic
Mineral Comparison
Mineral comparison score is based on the number of minerals by which one or the other food is richer. The "coverage" charts below show how much of the daily needs can be covered by 300 grams of the food.
4
100 g
300 g
1 cup, chopped or diced - 140g 1 unit (yield from 1 lb ready-to-cook duck) - 173g 0.5 duck - 382g
Magnesium
Magnesium
Calcium
Calcium
Potassium
Potassium
Iron
Iron
Copper
Copper
Zinc
Zinc
Phosphorus
Phosphorus
Sodium
Sodium
Manganese
Manganese
Selenium
Selenium
11%
3.3%
18%
101%
76%
51%
67%
7.7%
2.5%
109%
3
100 g
300 g
1 slice (1 oz) - 28g 1 package, 2.5 oz - 71g
Magnesium
Magnesium
Calcium
Calcium
Potassium
Potassium
Iron
Iron
Copper
Copper
Zinc
Zinc
Phosphorus
Phosphorus
Sodium
Sodium
Manganese
Manganese
Selenium
Selenium
12%
3%
19%
83%
30%
136%
75%
141%
3.5%
97%
Vitamin Comparison
Vitamin comparison score is based on the number of vitamins by which one or the other food is richer. The "coverage" charts below show how much of the daily needs can be covered by 300 grams of the food.
7
100 g
300 g
1 cup, chopped or diced - 140g 1 unit (yield from 1 lb ready-to-cook duck) - 173g 0.5 duck - 382g
Vitamin C
Vit. C
Vitamin D
Vit. D
Vitamin A
Vit. A
Vitamin E
Vit. E
Vitamin B1
Vit. B1
Vitamin B2
Vit. B2
Vitamin B3
Vit. B3
Vitamin B5
Vit. B5
Vitamin B6
Vit. B6
Vitamin B12
Vit. B12
Vitamin K
Vit. K
Folate
Folate
0%
1.5%
21%
14%
44%
62%
90%
66%
42%
38%
13%
4.5%
3
100 g
300 g
1 slice (1 oz) - 28g 1 package, 2.5 oz - 71g
Vitamin C
Vit. C
Vitamin D
Vit. D
Vitamin A
Vit. A
Vitamin E
Vit. E
Vitamin B1
Vit. B1
Vitamin B2
Vit. B2
Vitamin B3
Vit. B3
Vitamin B5
Vit. B5
Vitamin B6
Vit. B6
Vitamin B12
Vit. B12
Vitamin K
Vit. K
Folate
Folate
1%
1.5%
0.67%
2.4%
13%
37%
80%
16%
51%
234%
1.8%
4.5%
All nutrients comparison - raw data values
Nutrient
DV% diff.
Vitamin B12
0.3µg
1.87µg
65%
Sodium
59mg
1078mg
44%
Fats
28.35g
5.82g
35%
Saturated fat
9.67g
2.681g
32%
Zinc
1.86mg
4.98mg
28%
Monounsaturated fat
12.9g
2.118g
27%
Polyunsaturated fat
3.65g
0.145g
23%
Vitamin B5
1.098mg
0.265mg
17%
Copper
0.227mg
0.091mg
15%
Calories
337kcal
147kcal
10%
Vitamin B1
0.174mg
0.052mg
10%
Vitamin B2
0.269mg
0.161mg
8%
Vitamin A
63µg
2µg
7%
Protein
18.99g
21.8g
6%
Iron
2.7mg
2.22mg
6%
Choline
50.4mg
81.6mg
6%
Cholesterol
84mg
68mg
5%
Vitamin E
0.7mg
0.12mg
4%
Selenium
20µg
17.7µg
4%
Vitamin B3
4.825mg
4.26mg
4%
Vitamin K
5.1µg
0.7µg
4%
Phosphorus
156mg
175mg
3%
Vitamin B6
0.18mg
0.221mg
3%
Protein per 100 calories
5.6g
15g
N/A
Calories per 10 g protein
177kcal
67kcal
N/A
Weight per 100 calories
30g
68g
N/A
Unsaturated / Saturated Fat ratio
1.7
0.84
N/A
Vitamin C
0mg
0.3mg
0%
Net carbs
0g
0.36g
N/A
Carbs
0g
0.36g
0%
Vitamin D*
3 IU
4 IU
0%
Vitamin D
0.1µg
0.1µg
0%
Magnesium
16mg
17mg
0%
Calcium
11mg
10mg
0%
Potassium
204mg
210mg
0%
Sugar
0g
0.1g
N/A
Manganese
0.019mg
0.027mg
0%
Folate
6µg
6µg
0%
Tryptophan
0.232mg
0.141mg
0%
Threonine
0.773mg
0.857mg
0%
Isoleucine
0.872mg
0.976mg
0%
Leucine
1.465mg
1.706mg
0%
Lysine
1.486mg
1.812mg
0%
Methionine
0.475mg
0.558mg
0%
Phenylalanine
0.752mg
0.847mg
0%
Valine
0.938mg
1.065mg
0%
Histidine
0.462mg
0.684mg
0%
Fructose
0.01g
0%
Macronutrient Comparison
Macronutrient breakdown side-by-side comparison
1
19%
28%
52%
Protein:
18.99 g
Fats:
28.35 g
Carbs:
0 g
Water:
51.84 g
Other:
0.82 g
4
22%
6%
70%
2%
Protein:
21.8 g
Fats:
5.82 g
Carbs:
0.36 g
Water:
69.53 g
Other:
2.49 g
Contains
more
Fats Fats
+387.1%
Contains
more
Protein Protein
+14.8%
Contains
more
Carbs Carbs
+∞%
Contains
more
Water Water
+34.1%
Contains
more
Other Other
+203.7%
Fat Type Comparison
Fat type breakdown side-by-side comparison
2
37%
49%
14%
Saturated fat:
Sat. Fat
9.67 g
Monounsaturated fat:
Mono. Fat
12.9 g
Polyunsaturated fat:
Poly. Fat
3.65 g
1
54%
43%
3%
Saturated fat:
Sat. Fat
2.681 g
Monounsaturated fat:
Mono. Fat
2.118 g
Polyunsaturated fat:
Poly. Fat
0.145 g
Contains
more
Mono. Fat Monounsaturated fat
+509.1%
Contains
more
Poly. Fat Polyunsaturated fat
+2417.2%
Contains
less
Sat. Fat Saturated fat
-72.3%