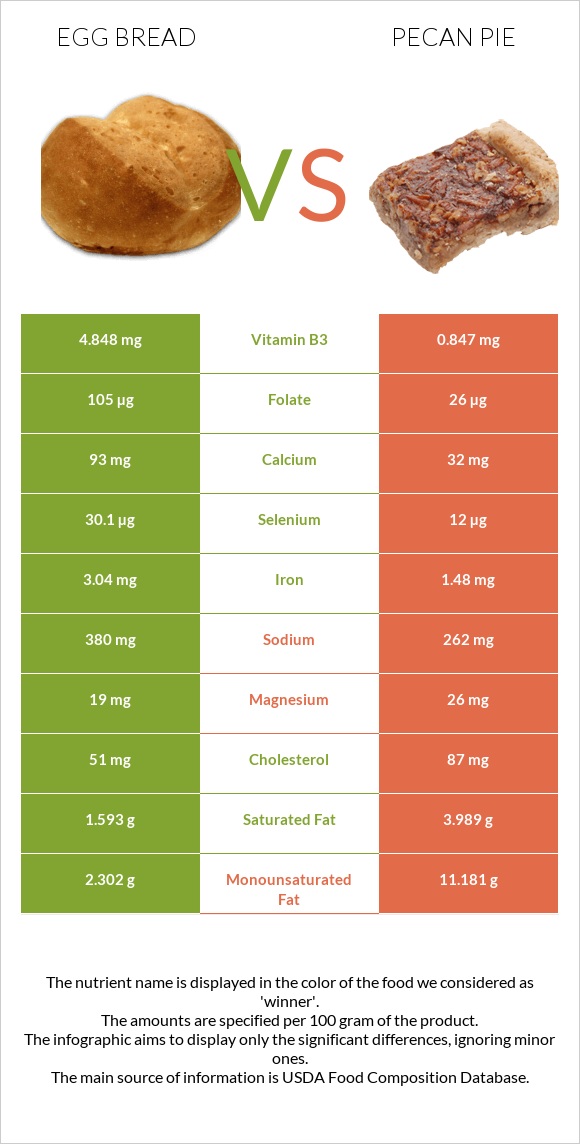
Important differences between egg bread and pecan pie Egg bread has more selenium, vitamin B3, vitamin B1, folate, vitamin B2, iron, and calcium; however, pecan pie has more manganese. Egg bread's daily need coverage for selenium is 33% more. Egg bread has 6 times more vitamin B3 than pecan pie. Egg bread has 4.848mg of vitamin B3, while pecan pie has 0.847mg. Egg bread is lower in cholesterol. Egg bread has a higher glycemic index than pecan pie. The food varieties used in the comparison are Bread, egg and Pie, pecan, prepared from recipe .
Infographic
Mineral Comparison
Mineral comparison score is based on the number of minerals by which one or the other food is richer. The "coverage" charts below show how much of the daily needs can be covered by 300 grams of the food.
4
100 g
300 g
1 oz - 28.35g 1 slice (5" x 3" x 1/2") - 40g
Magnesium
Magnesium
Calcium
Calcium
Potassium
Potassium
Iron
Iron
Copper
Copper
Zinc
Zinc
Phosphorus
Phosphorus
Sodium
Sodium
Manganese
Manganese
Selenium
Selenium
14%
28%
10%
114%
54%
22%
45%
50%
65%
164%
6
100 g
300 g
1 oz - 28.35g 1 piece (1/8 of 9" dia) - 122g
Magnesium
Magnesium
Calcium
Calcium
Potassium
Potassium
Iron
Iron
Copper
Copper
Zinc
Zinc
Phosphorus
Phosphorus
Sodium
Sodium
Manganese
Manganese
Selenium
Selenium
19%
9.6%
12%
56%
70%
28%
40%
34%
93%
65%
Vitamin Comparison
Vitamin comparison score is based on the number of vitamins by which one or the other food is richer. The "coverage" charts below show how much of the daily needs can be covered by 300 grams of the food.
7
100 g
300 g
1 oz - 28.35g 1 slice (5" x 3" x 1/2") - 40g
Vitamin C
Vit. C
Vitamin D
Vit. D
Vitamin A
Vit. A
Vitamin E
Vit. E
Vitamin B1
Vit. B1
Vitamin B2
Vit. B2
Vitamin B3
Vit. B3
Vitamin B5
Vit. B5
Vitamin B6
Vit. B6
Vitamin B12
Vit. B12
Vitamin K
Vit. K
Folate
Folate
0%
6%
21%
5.2%
110%
101%
91%
17%
15%
13%
2.3%
79%
4
100 g
300 g
1 oz - 28.35g 1 piece (1/8 of 9" dia) - 122g
Vitamin C
Vit. C
Vitamin D
Vit. D
Vitamin A
Vit. A
Vitamin E
Vit. E
Vitamin B1
Vit. B1
Vitamin B2
Vit. B2
Vitamin B3
Vit. B3
Vitamin B5
Vit. B5
Vitamin B6
Vit. B6
Vitamin B12
Vit. B12
Vitamin K
Vit. K
Folate
Folate
0.67%
0%
27%
0%
47%
42%
16%
29%
14%
21%
0%
20%
All nutrients comparison - raw data values
Nutrient
DV% diff.
Selenium
30.1µg
12µg
33%
Polyunsaturated fat
1.106g
5.71g
31%
Fats
6g
22.2g
25%
Vitamin B3
4.848mg
0.847mg
25%
Monounsaturated fat
2.302g
11.181g
22%
Vitamin B1
0.438mg
0.188mg
21%
Iron
3.04mg
1.48mg
20%
Vitamin B2
0.436mg
0.18mg
20%
Folate
105µg
26µg
20%
Choline
84.3mg
15%
Cholesterol
51mg
87mg
12%
Saturated fat
1.593g
3.989g
11%
Protein
9.5g
4.9g
9%
Fiber
2.3g
9%
Manganese
0.5mg
0.712mg
9%
Calories
287kcal
412kcal
6%
Calcium
93mg
32mg
6%
Copper
0.162mg
0.211mg
5%
Sodium
380mg
262mg
5%
Vitamin B5
0.282mg
0.479mg
4%
Vitamin B12
0.1µg
0.17µg
3%
Vitamin D*
16 IU
2%
Vitamin D
0.4µg
2%
Magnesium
19mg
26mg
2%
Zinc
0.79mg
1.02mg
2%
Phosphorus
106mg
94mg
2%
Vitamin A
63µg
82µg
2%
Vitamin E
0.26mg
2%
Carbs
47.8g
52.2g
1%
Potassium
115mg
133mg
1%
Vitamin K
0.9µg
1%
Protein per 100 calories
3.3g
1.2g
N/A
Calories per 10 g protein
302kcal
841kcal
N/A
Weight per 100 calories
35g
24g
N/A
Unsaturated / Saturated Fat ratio
2.1
4.2
N/A
Vitamin C
0mg
0.2mg
0%
Net carbs
45.5g
52.2g
N/A
Sugar
1.78g
N/A
Vitamin B6
0.064mg
0.06mg
0%
Tryptophan
0.112mg
0.069mg
0%
Threonine
0.306mg
0.189mg
0%
Isoleucine
0.394mg
0.223mg
0%
Leucine
0.692mg
0.372mg
0%
Lysine
0.311mg
0.248mg
0%
Methionine
0.189mg
0.125mg
0%
Phenylalanine
0.475mg
0.25mg
0%
Valine
0.443mg
0.255mg
0%
Histidine
0.21mg
0.116mg
0%
Omega-3 - EPA
0.001g
0.001g
N/A
Omega-3 - DHA
0.012g
0.008g
N/A
Macronutrient Comparison
Macronutrient breakdown side-by-side comparison
3
10%
6%
48%
35%
2%
Protein:
9.5 g
Fats:
6 g
Carbs:
47.8 g
Water:
34.7 g
Other:
2 g
2
5%
22%
52%
20%
Protein:
4.9 g
Fats:
22.2 g
Carbs:
52.2 g
Water:
19.5 g
Other:
1.2 g
Contains
more
Protein Protein
+93.9%
Contains
more
Water Water
+77.9%
Contains
more
Other Other
+66.7%
Contains
more
Fats Fats
+270%
Fat Type Comparison
Fat type breakdown side-by-side comparison
1
32%
46%
22%
Saturated fat:
Sat. Fat
1.593 g
Monounsaturated fat:
Mono. Fat
2.302 g
Polyunsaturated fat:
Poly. Fat
1.106 g
2
19%
54%
27%
Saturated fat:
Sat. Fat
3.989 g
Monounsaturated fat:
Mono. Fat
11.181 g
Polyunsaturated fat:
Poly. Fat
5.71 g
Contains
less
Sat. Fat Saturated fat
-60.1%
Contains
more
Mono. Fat Monounsaturated fat
+385.7%
Contains
more
Poly. Fat Polyunsaturated fat
+416.3%