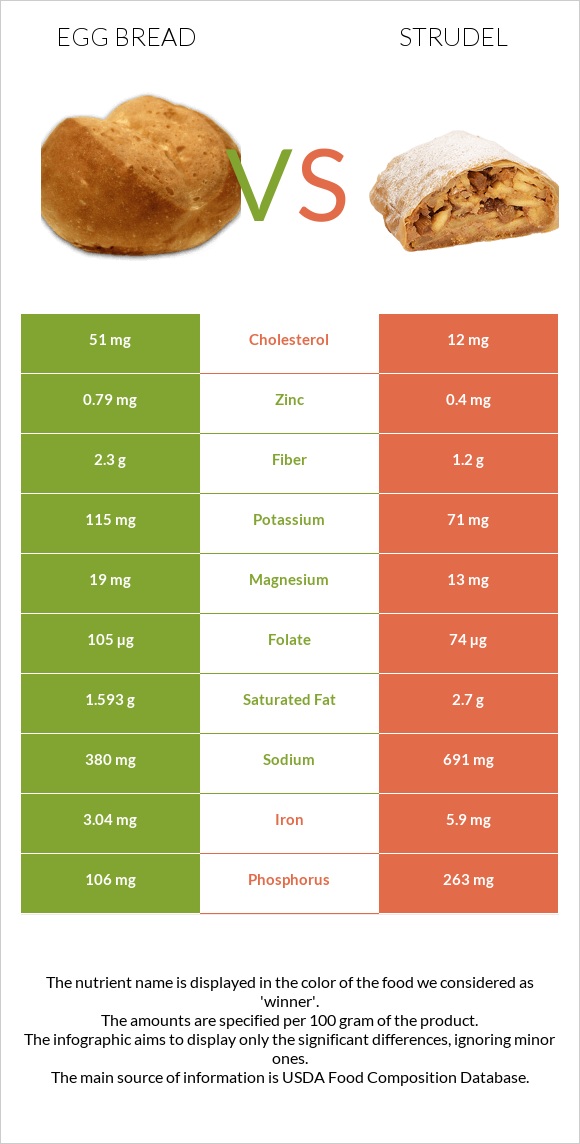
A recap on the differences between egg bread and strudel Egg bread is higher in folate, yet strudel is higher in vitamin B12, vitamin B6, iron, phosphorus, vitamin A, and calcium. Strudel covers your daily vitamin B12 needs 63% more than egg bread. Egg bread contains 4 times more cholesterol than strudel. While egg bread contains 51mg of cholesterol, strudel contains only 12mg. The glycemic index of strudel is lower. Food varieties used in this article are Bread, egg and KELLOGG'S, EGGO, Wafflers, Strawberry Strudel .
Infographic
Mineral Comparison
Mineral comparison score is based on the number of minerals by which one or the other food is richer. The "coverage" charts below show how much of the daily needs can be covered by 300 grams of the food.
7
100 g
300 g
1 oz - 28.35g 1 slice (5" x 3" x 1/2") - 40g
Magnesium
Magnesium
Calcium
Calcium
Potassium
Potassium
Iron
Iron
Copper
Copper
Zinc
Zinc
Phosphorus
Phosphorus
Sodium
Sodium
Manganese
Manganese
Selenium
Selenium
14%
28%
10%
114%
54%
22%
45%
50%
65%
164%
3
100 g
300 g
2 waffles - 76g
Magnesium
Magnesium
Calcium
Calcium
Potassium
Potassium
Iron
Iron
Copper
Copper
Zinc
Zinc
Phosphorus
Phosphorus
Sodium
Sodium
Manganese
Manganese
Selenium
Selenium
9.3%
88%
6.3%
221%
0%
11%
113%
90%
0%
0%
Vitamin Comparison
Vitamin comparison score is based on the number of vitamins by which one or the other food is richer. The "coverage" charts below show how much of the daily needs can be covered by 300 grams of the food.
6
100 g
300 g
1 oz - 28.35g 1 slice (5" x 3" x 1/2") - 40g
Vitamin C
Vit. C
Vitamin D
Vit. D
Vitamin A
Vit. A
Vitamin E
Vit. E
Vitamin B1
Vit. B1
Vitamin B2
Vit. B2
Vitamin B3
Vit. B3
Vitamin B5
Vit. B5
Vitamin B6
Vit. B6
Vitamin B12
Vit. B12
Vitamin K
Vit. K
Folate
Folate
0%
6%
21%
5.2%
110%
101%
91%
17%
15%
13%
2.3%
79%
3
100 g
300 g
2 waffles - 76g
Vitamin C
Vit. C
Vitamin D
Vit. D
Vitamin A
Vit. A
Vitamin E
Vit. E
Vitamin B1
Vit. B1
Vitamin B2
Vit. B2
Vitamin B3
Vit. B3
Vitamin B5
Vit. B5
Vitamin B6
Vit. B6
Vitamin B12
Vit. B12
Vitamin K
Vit. K
Folate
Folate
0%
0%
132%
0%
98%
104%
99%
0%
122%
200%
0%
56%
All nutrients comparison - raw data values
Nutrient
DV% diff.
Vitamin B12
0.1µg
1.6µg
63%
Selenium
30.1µg
55%
Vitamin A
63µg
395µg
37%
Iron
3.04mg
5.9mg
36%
Vitamin B6
0.064mg
0.53mg
36%
Polyunsaturated fat
1.106g
4.6g
23%
Phosphorus
106mg
263mg
22%
Manganese
0.5mg
22%
Calcium
93mg
293mg
20%
Copper
0.162mg
18%
Choline
84.3mg
15%
Sodium
380mg
691mg
14%
Cholesterol
51mg
12mg
13%
Protein
9.5g
5g
9%
Fats
6g
11g
8%
Folate
105µg
74µg
8%
Vitamin B5
0.282mg
6%
Saturated fat
1.593g
2.7g
5%
Fiber
2.3g
1.2g
4%
Zinc
0.79mg
0.4mg
4%
Vitamin B1
0.438mg
0.39mg
4%
Vitamin B3
4.848mg
5.3mg
3%
Calories
287kcal
318kcal
2%
Vitamin D*
16 IU
1 IU
2%
Vitamin D
0.4µg
0µg
2%
Vitamin E
0.26mg
0mg
2%
Carbs
47.8g
50g
1%
Magnesium
19mg
13mg
1%
Potassium
115mg
71mg
1%
Vitamin B2
0.436mg
0.45mg
1%
Vitamin K
0.9µg
1%
Monounsaturated fat
2.302g
2.8g
1%
Protein per 100 calories
3.3g
1.6g
N/A
Calories per 10 g protein
302kcal
636kcal
N/A
Weight per 100 calories
35g
31g
N/A
Unsaturated / Saturated Fat ratio
2.1
2.7
N/A
Net carbs
45.5g
48.8g
N/A
Sugar
1.78g
16.8g
N/A
Trans fat
0.2g
N/A
Tryptophan
0.112mg
0%
Threonine
0.306mg
0%
Isoleucine
0.394mg
0%
Leucine
0.692mg
0%
Lysine
0.311mg
0%
Methionine
0.189mg
0%
Phenylalanine
0.475mg
0%
Valine
0.443mg
0%
Histidine
0.21mg
0%
Omega-3 - EPA
0.001g
N/A
Omega-3 - DHA
0.012g
N/A
Macronutrient Comparison
Macronutrient breakdown side-by-side comparison
2
10%
6%
48%
35%
2%
Protein:
9.5 g
Fats:
6 g
Carbs:
47.8 g
Water:
34.7 g
Other:
2 g
3
5%
11%
50%
29%
5%
Protein:
5 g
Fats:
11 g
Carbs:
50 g
Water:
29.2 g
Other:
4.8 g
Contains
more
Protein Protein
+90%
Contains
more
Water Water
+18.8%
Contains
more
Fats Fats
+83.3%
Contains
more
Other Other
+140%
Fat Type Comparison
Fat type breakdown side-by-side comparison
1
32%
46%
22%
Saturated fat:
Sat. Fat
1.593 g
Monounsaturated fat:
Mono. Fat
2.302 g
Polyunsaturated fat:
Poly. Fat
1.106 g
2
27%
28%
46%
Saturated fat:
Sat. Fat
2.7 g
Monounsaturated fat:
Mono. Fat
2.8 g
Polyunsaturated fat:
Poly. Fat
4.6 g
Contains
less
Sat. Fat Saturated fat
-41%
Contains
more
Mono. Fat Monounsaturated fat
+21.6%
Contains
more
Poly. Fat Polyunsaturated fat
+315.9%