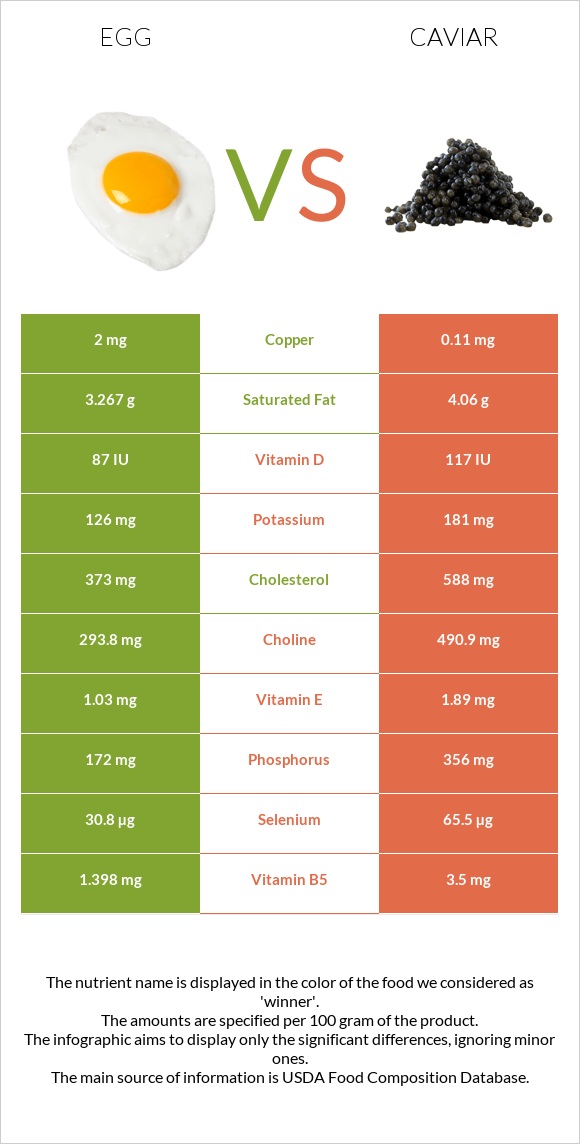
Differences between eggs and caviar Eggs have more copper, while caviar has more vitamin B12, iron, magnesium, selenium, vitamin B5, choline, and phosphorus. Caviar's daily need coverage for vitamin B12 is 787% higher. Caviar contains 18 times less copper than eggs. Eggs contain 2mg of copper, while caviar contains 0.11mg. The amount of cholesterol in eggs is lower. The food types used in this comparison are Egg, whole, cooked, hard-boiled and Fish, caviar, black, and red, granular .
Infographic
Mineral Comparison
Mineral comparison score is based on the number of minerals by which one or the other food is richer. The "coverage" charts below show how much of the daily needs can be covered by 300 grams of the food.
2
100 g
300 g
1 tbsp - 8.5g 1 large - 50g 1 cup, chopped - 136g
Magnesium
Magnesium
Calcium
Calcium
Potassium
Potassium
Iron
Iron
Copper
Copper
Zinc
Zinc
Phosphorus
Phosphorus
Sodium
Sodium
Manganese
Manganese
Selenium
Selenium
7.1%
15%
11%
45%
667%
29%
74%
16%
3.4%
168%
7
100 g
300 g
1 tbsp - 16g 1 oz - 28.35g
Magnesium
Magnesium
Calcium
Calcium
Potassium
Potassium
Iron
Iron
Copper
Copper
Zinc
Zinc
Phosphorus
Phosphorus
Sodium
Sodium
Manganese
Manganese
Selenium
Selenium
214%
83%
16%
446%
37%
26%
153%
196%
6.5%
357%
Vitamin Comparison
Vitamin comparison score is based on the number of vitamins by which one or the other food is richer. The "coverage" charts below show how much of the daily needs can be covered by 300 grams of the food.
0
100 g
300 g
1 tbsp - 8.5g 1 large - 50g 1 cup, chopped - 136g
Vitamin C
Vit. C
Vitamin D
Vit. D
Vitamin A
Vit. A
Vitamin E
Vit. E
Vitamin B1
Vit. B1
Vitamin B2
Vit. B2
Vitamin B3
Vit. B3
Vitamin B5
Vit. B5
Vitamin B6
Vit. B6
Vitamin B12
Vit. B12
Vitamin K
Vit. K
Folate
Folate
0%
33%
50%
21%
17%
118%
1.2%
84%
28%
139%
0.75%
33%
11
100 g
300 g
1 tbsp - 16g 1 oz - 28.35g
Vitamin C
Vit. C
Vitamin D
Vit. D
Vitamin A
Vit. A
Vitamin E
Vit. E
Vitamin B1
Vit. B1
Vitamin B2
Vit. B2
Vitamin B3
Vit. B3
Vitamin B5
Vit. B5
Vitamin B6
Vit. B6
Vitamin B12
Vit. B12
Vitamin K
Vit. K
Folate
Folate
0%
44%
90%
38%
48%
143%
2.3%
210%
74%
2500%
1.5%
38%
All nutrients comparison - raw data values
Nutrient
DV% diff.
Vitamin B12
1.11µg
20µg
787%
Copper
2mg
0.11mg
210%
Iron
1.19mg
11.88mg
134%
Cholesterol
373mg
588mg
72%
Magnesium
10mg
300mg
69%
Selenium
30.8µg
65.5µg
63%
Sodium
124mg
1500mg
60%
Vitamin B5
1.398mg
3.5mg
42%
Polyunsaturated fat
1.414g
7.405g
40%
Choline
293.8mg
490.9mg
36%
Phosphorus
172mg
356mg
26%
Protein
12.58g
24.6g
24%
Calcium
50mg
275mg
23%
Vitamin B6
0.121mg
0.32mg
15%
Vitamin A
149µg
271µg
14%
Fats
10.61g
17.9g
11%
Vitamin B1
0.066mg
0.19mg
10%
Vitamin B2
0.513mg
0.62mg
8%
Vitamin E
1.03mg
1.89mg
6%
Calories
155kcal
264kcal
5%
Vitamin D*
87 IU
117 IU
4%
Vitamin D
2.2µg
2.9µg
4%
Saturated fat
3.267g
4.06g
4%
Potassium
126mg
181mg
2%
Folate
44µg
50µg
2%
Carbs
1.12g
4g
1%
Zinc
1.05mg
0.95mg
1%
Manganese
0.026mg
0.05mg
1%
Monounsaturated fat
4.077g
4.631g
1%
Protein per 100 calories
8.1g
9.3g
N/A
Calories per 10 g protein
123kcal
107kcal
N/A
Weight per 100 calories
65g
38g
N/A
Unsaturated / Saturated Fat ratio
1.7
3
N/A
Net carbs
1.12g
4g
N/A
Sugar
1.12g
0g
N/A
Vitamin B3
0.064mg
0.12mg
0%
Vitamin K
0.3µg
0.6µg
0%
Tryptophan
0.153mg
0.323mg
0%
Threonine
0.604mg
1.263mg
0%
Isoleucine
0.686mg
1.035mg
0%
Leucine
1.075mg
2.133mg
0%
Lysine
0.904mg
1.834mg
0%
Methionine
0.392mg
0.646mg
0%
Phenylalanine
0.668mg
1.071mg
0%
Valine
0.767mg
1.263mg
0%
Histidine
0.298mg
0.649mg
0%
Omega-3 - EPA
0.005g
2.741g
N/A
Omega-3 - DHA
0.038g
3.8g
N/A
Omega-3 - DPA
0g
0.229g
N/A
Macronutrient Comparison
Macronutrient breakdown side-by-side comparison
1
13%
11%
75%
Protein:
12.58 g
Fats:
10.61 g
Carbs:
1.12 g
Water:
74.62 g
Other:
1.07 g
4
25%
18%
4%
48%
6%
Protein:
24.6 g
Fats:
17.9 g
Carbs:
4 g
Water:
47.5 g
Other:
6 g
Contains
more
Water Water
+57.1%
Contains
more
Protein Protein
+95.5%
Contains
more
Fats Fats
+68.7%
Contains
more
Carbs Carbs
+257.1%
Contains
more
Other Other
+460.7%
Fat Type Comparison
Fat type breakdown side-by-side comparison
1
37%
47%
16%
Saturated fat:
Sat. Fat
3.267 g
Monounsaturated fat:
Mono. Fat
4.077 g
Polyunsaturated fat:
Poly. Fat
1.414 g
2
25%
29%
46%
Saturated fat:
Sat. Fat
4.06 g
Monounsaturated fat:
Mono. Fat
4.631 g
Polyunsaturated fat:
Poly. Fat
7.405 g
Contains
less
Sat. Fat Saturated fat
-19.5%
Contains
more
Mono. Fat Monounsaturated fat
+13.6%
Contains
more
Poly. Fat Polyunsaturated fat
+423.7%