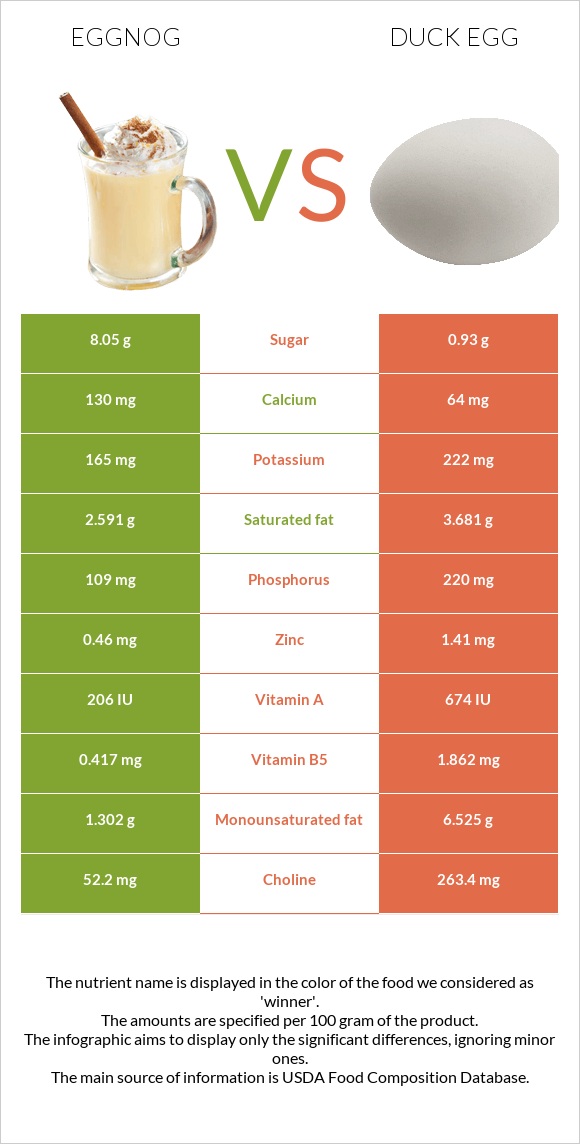
A recap on the differences between eggnog and duck eggs Duck eggs are higher than eggnog in vitamin B12, selenium, iron, choline, vitamin B5, folate, vitamin B2, phosphorus, and vitamin B6. Duck eggs cover your daily cholesterol needs 275% more than eggnog. The amount of cholesterol in eggnog is lower. Food varieties used in this article are Eggnog and Egg, duck, whole, fresh, raw .
Infographic
Mineral Comparison
Mineral comparison score is based on the number of minerals by which one or the other food is richer. The "coverage" charts below show how much of the daily needs can be covered by 300 grams of the food.
3
100 g
300 g
1 fl oz - 31.8g 1 cup - 254g 1 quart - 1016g
Magnesium
Magnesium
Calcium
Calcium
Potassium
Potassium
Iron
Iron
Copper
Copper
Zinc
Zinc
Phosphorus
Phosphorus
Sodium
Sodium
Manganese
Manganese
Selenium
Selenium
14%
39%
15%
7.5%
4.3%
13%
47%
7%
0.65%
23%
7
100 g
300 g
1 egg - 70g
Magnesium
Magnesium
Calcium
Calcium
Potassium
Potassium
Iron
Iron
Copper
Copper
Zinc
Zinc
Phosphorus
Phosphorus
Sodium
Sodium
Manganese
Manganese
Selenium
Selenium
12%
19%
20%
144%
21%
38%
94%
19%
5%
199%
Vitamin Comparison
Vitamin comparison score is based on the number of vitamins by which one or the other food is richer. The "coverage" charts below show how much of the daily needs can be covered by 300 grams of the food.
1
100 g
300 g
1 fl oz - 31.8g 1 cup - 254g 1 quart - 1016g
Vitamin C
Vit. C
Vitamin D
Vit. D
Vitamin A
Vit. A
Vitamin E
Vit. E
Vitamin B1
Vit. B1
Vitamin B2
Vit. B2
Vitamin B3
Vit. B3
Vitamin B5
Vit. B5
Vitamin B6
Vit. B6
Vitamin B12
Vit. B12
Vitamin K
Vit. K
Folate
Folate
5%
18%
20%
4.2%
8.5%
44%
2%
25%
12%
56%
0.75%
0.75%
11
100 g
300 g
1 egg - 70g
Vitamin C
Vit. C
Vitamin D
Vit. D
Vitamin A
Vit. A
Vitamin E
Vit. E
Vitamin B1
Vit. B1
Vitamin B2
Vit. B2
Vitamin B3
Vit. B3
Vitamin B5
Vit. B5
Vitamin B6
Vit. B6
Vitamin B12
Vit. B12
Vitamin K
Vit. K
Folate
Folate
0%
26%
65%
27%
39%
93%
3.8%
112%
58%
675%
1%
60%
All nutrients comparison - raw data values
Nutrient
DV% diff.
Cholesterol
59mg
884mg
275%
Vitamin B12
0.45µg
5.4µg
206%
Selenium
4.2µg
36.4µg
59%
Iron
0.2mg
3.85mg
46%
Choline
52.2mg
263.4mg
38%
Vitamin B5
0.417mg
1.862mg
29%
Folate
1µg
80µg
20%
Protein
4.55g
12.81g
17%
Phosphorus
109mg
220mg
16%
Vitamin B2
0.19mg
0.404mg
16%
Fats
4.19g
13.77g
15%
Vitamin A
59µg
194µg
15%
Vitamin B6
0.05mg
0.25mg
15%
Monounsaturated fat
1.302g
6.525g
13%
Vitamin B1
0.034mg
0.156mg
10%
Zinc
0.46mg
1.41mg
9%
Vitamin E
0.21mg
1.34mg
8%
Calcium
130mg
64mg
7%
Polyunsaturated fat
0.198g
1.223g
7%
Calories
88kcal
185kcal
5%
Copper
0.013mg
0.062mg
5%
Saturated fat
2.591g
3.681g
5%
Sodium
54mg
146mg
4%
Vitamin D*
49 IU
69 IU
3%
Vitamin D
1.2µg
1.7µg
3%
Vitamin C
1.5mg
0mg
2%
Carbs
8.05g
1.45g
2%
Potassium
165mg
222mg
2%
Manganese
0.005mg
0.038mg
1%
Vitamin B3
0.105mg
0.2mg
1%
Protein per 100 calories
5.2g
6.9g
N/A
Calories per 10 g protein
193kcal
144kcal
N/A
Weight per 100 calories
114g
54g
N/A
Unsaturated / Saturated Fat ratio
0.58
2.1
N/A
Net carbs
8.05g
1.45g
N/A
Magnesium
19mg
17mg
0%
Sugar
8.05g
0.93g
N/A
Vitamin K
0.3µg
0.4µg
0%
Tryptophan
0.085mg
0.26mg
0%
Threonine
0.201mg
0.736mg
0%
Isoleucine
0.237mg
0.598mg
0%
Leucine
0.383mg
1.097mg
0%
Lysine
0.257mg
0.951mg
0%
Methionine
0.12mg
0.576mg
0%
Phenylalanine
0.225mg
0.84mg
0%
Valine
0.289mg
0.885mg
0%
Histidine
0.108mg
0.32mg
0%
Fructose
0.04g
0%
Macronutrient Comparison
Macronutrient breakdown side-by-side comparison
2
5%
4%
8%
83%
Protein:
4.55 g
Fats:
4.19 g
Carbs:
8.05 g
Water:
82.54 g
Other:
0.67 g
3
13%
14%
71%
Protein:
12.81 g
Fats:
13.77 g
Carbs:
1.45 g
Water:
70.83 g
Other:
1.14 g
Contains
more
Carbs Carbs
+455.2%
Contains
more
Water Water
+16.5%
Contains
more
Protein Protein
+181.5%
Contains
more
Fats Fats
+228.6%
Contains
more
Other Other
+70.1%
Fat Type Comparison
Fat type breakdown side-by-side comparison
1
63%
32%
5%
Saturated fat:
Sat. Fat
2.591 g
Monounsaturated fat:
Mono. Fat
1.302 g
Polyunsaturated fat:
Poly. Fat
0.198 g
2
32%
57%
11%
Saturated fat:
Sat. Fat
3.681 g
Monounsaturated fat:
Mono. Fat
6.525 g
Polyunsaturated fat:
Poly. Fat
1.223 g
Contains
less
Sat. Fat Saturated fat
-29.6%
Contains
more
Mono. Fat Monounsaturated fat
+401.2%
Contains
more
Poly. Fat Polyunsaturated fat
+517.7%