Enoki mushrooms vs. Edible mushroom — In-Depth Nutrition Comparison
Compare
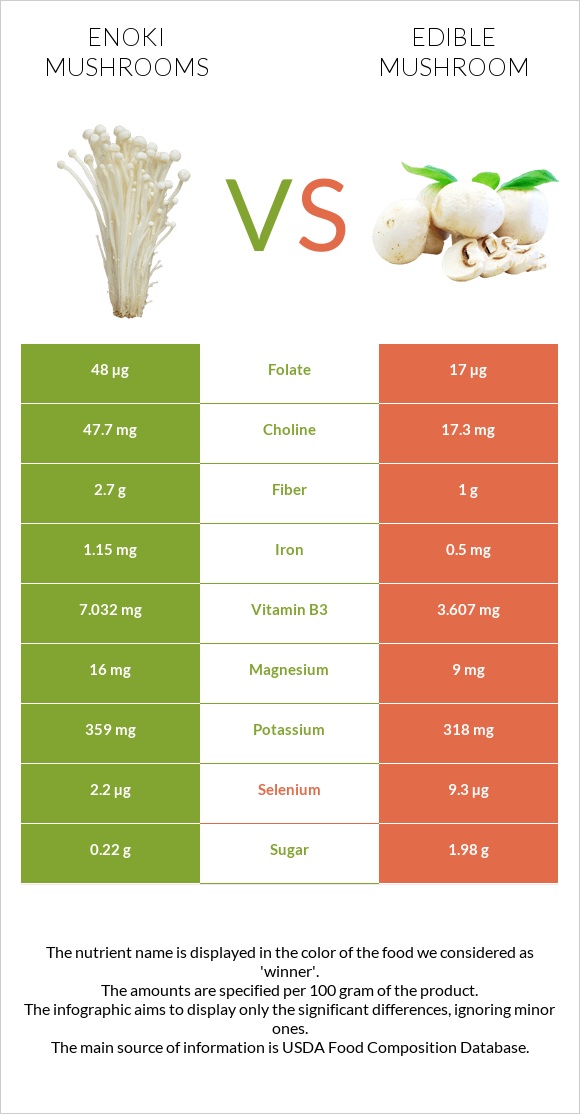
Significant differences between enoki mushrooms and edible mushroom
- Enoki mushrooms are richer in vitamin B3, vitamin B1, iron, folate, fiber, and choline, while edible mushroom is higher in copper, vitamin B2, and selenium.
- Edible mushroom covers your daily copper needs 23% more than enoki mushrooms.
- Enoki mushrooms have 3 times more folate than edible mushroom. Enoki mushrooms have 48µg of folate, while edible mushroom has 17µg.
Specific food types used in this comparison are Mushrooms, enoki, raw and Mushrooms, white, raw.
Infographic
Infographic link
Mineral Comparison
Mineral comparison score is based on the number of minerals by which one or the other food is richer. The "coverage" charts below show how much of the daily needs can be covered by 300 grams of the food.
| Contains more MagnesiumMagnesium | +77.8% |
| Contains more PotassiumPotassium | +12.9% |
| Contains more IronIron | +130% |
| Contains more ZincZinc | +25% |
| Contains more PhosphorusPhosphorus | +22.1% |
| Contains less SodiumSodium | -40% |
| Contains more ManganeseManganese | +59.6% |
| Contains more CalciumCalcium | +∞% |
| Contains more CopperCopper | +197.2% |
| Contains more SeleniumSelenium | +322.7% |
Vitamin Comparison
Vitamin comparison score is based on the number of vitamins by which one or the other food is richer. The "coverage" charts below show how much of the daily needs can be covered by 300 grams of the food.
| Contains more Vitamin B1Vitamin B1 | +177.8% |
| Contains more Vitamin B3Vitamin B3 | +95% |
| Contains more FolateFolate | +182.4% |
| Contains more Vitamin CVitamin C | +∞% |
| Contains more Vitamin DVitamin D | +100% |
| Contains more Vitamin B2Vitamin B2 | +101% |
| Contains more Vitamin B5Vitamin B5 | +10.9% |
| Contains more Vitamin B12Vitamin B12 | +∞% |
All nutrients comparison - raw data values
| Nutrient |  |
 |
DV% diff. |
| Copper | 0.107mg | 0.318mg | 23% |
| Vitamin B3 | 7.032mg | 3.607mg | 21% |
| Vitamin B2 | 0.2mg | 0.402mg | 16% |
| Selenium | 2.2µg | 9.3µg | 13% |
| Vitamin B1 | 0.225mg | 0.081mg | 12% |
| Iron | 1.15mg | 0.5mg | 8% |
| Folate | 48µg | 17µg | 8% |
| Fiber | 2.7g | 1g | 7% |
| Choline | 47.7mg | 17.3mg | 6% |
| Phosphorus | 105mg | 86mg | 3% |
| Vitamin B5 | 1.35mg | 1.497mg | 3% |
| Vitamin C | 0mg | 2.1mg | 2% |
| Carbs | 7.81g | 3.26g | 2% |
| Magnesium | 16mg | 9mg | 2% |
| Vitamin B12 | 0µg | 0.04µg | 2% |
| Calories | 37kcal | 22kcal | 1% |
| Protein | 2.66g | 3.09g | 1% |
| Vitamin D | 0.1µg | 0.2µg | 1% |
| Potassium | 359mg | 318mg | 1% |
| Zinc | 0.65mg | 0.52mg | 1% |
| Manganese | 0.075mg | 0.047mg | 1% |
| Protein per 100 calories | 7.2g | 14g | N/A |
| Calories per 10 g protein | 139kcal | 71kcal | N/A |
| Weight per 100 calories | 270g | 455g | N/A |
| Fats | 0.29g | 0.34g | 0% |
| Net carbs | 5.11g | 2.26g | N/A |
| Vitamin D* | 5 IU | 7 IU | 0% |
| Calcium | 0mg | 3mg | 0% |
| Sugar | 0.22g | 1.98g | N/A |
| Sodium | 3mg | 5mg | 0% |
| Vitamin E | 0.01mg | 0.01mg | 0% |
| Vitamin B6 | 0.1mg | 0.104mg | 0% |
| Saturated fat | 0.02g | 0.05g | 0% |
| Polyunsaturated fat | 0.09g | 0.16g | 0% |
| Tryptophan | 0.04mg | 0.035mg | 0% |
| Threonine | 0.11mg | 0.107mg | 0% |
| Isoleucine | 0.09mg | 0.076mg | 0% |
| Leucine | 0.13mg | 0.12mg | 0% |
| Lysine | 0.13mg | 0.107mg | 0% |
| Methionine | 0.03mg | 0.031mg | 0% |
| Phenylalanine | 0.15mg | 0.085mg | 0% |
| Valine | 0.23mg | 0.232mg | 0% |
| Histidine | 0.07mg | 0.057mg | 0% |
| Fructose | 0g | 0.17g | 0% |
Macronutrient Comparison
Macronutrient breakdown side-by-side comparison
Protein:
2.66 g
Fats:
0.29 g
Carbs:
7.81 g
Water:
88.34 g
Other:
0.9 g
Protein:
3.09 g
Fats:
0.34 g
Carbs:
3.26 g
Water:
92.45 g
Other:
0.86 g
| Contains more CarbsCarbs | +139.6% |
| Contains more ProteinProtein | +16.2% |
| Contains more FatsFats | +17.2% |
~equal in
Water
~92.45g
~equal in
Other
~0.86g
Fat Type Comparison
Fat type breakdown side-by-side comparison
Saturated fat:
Sat. Fat
0.02 g
Monounsaturated fat:
Mono. Fat
0 g
Polyunsaturated fat:
Poly. Fat
0.09 g
Saturated fat:
Sat. Fat
0.05 g
Monounsaturated fat:
Mono. Fat
0 g
Polyunsaturated fat:
Poly. Fat
0.16 g
| Contains less Sat. FatSaturated fat | -60% |
| Contains more Poly. FatPolyunsaturated fat | +77.8% |
~equal in
Monounsaturated fat
~0g
Carbohydrate type comparison
Carbohydrate type breakdown side-by-side comparison
Starch:
0 g
Sucrose:
0 g
Glucose:
0.22 g
Fructose:
0 g
Lactose:
0 g
Maltose:
0 g
Galactose:
0 g
Starch:
0 g
Sucrose:
0 g
Glucose:
1.48 g
Fructose:
0.17 g
Lactose:
0 g
Maltose:
0 g
Galactose:
0 g
| Contains more GlucoseGlucose | +572.7% |
| Contains more FructoseFructose | +∞% |
~equal in
Starch
~0g
~equal in
Sucrose
~0g
~equal in
Lactose
~0g
~equal in
Maltose
~0g
~equal in
Galactose
~0g


