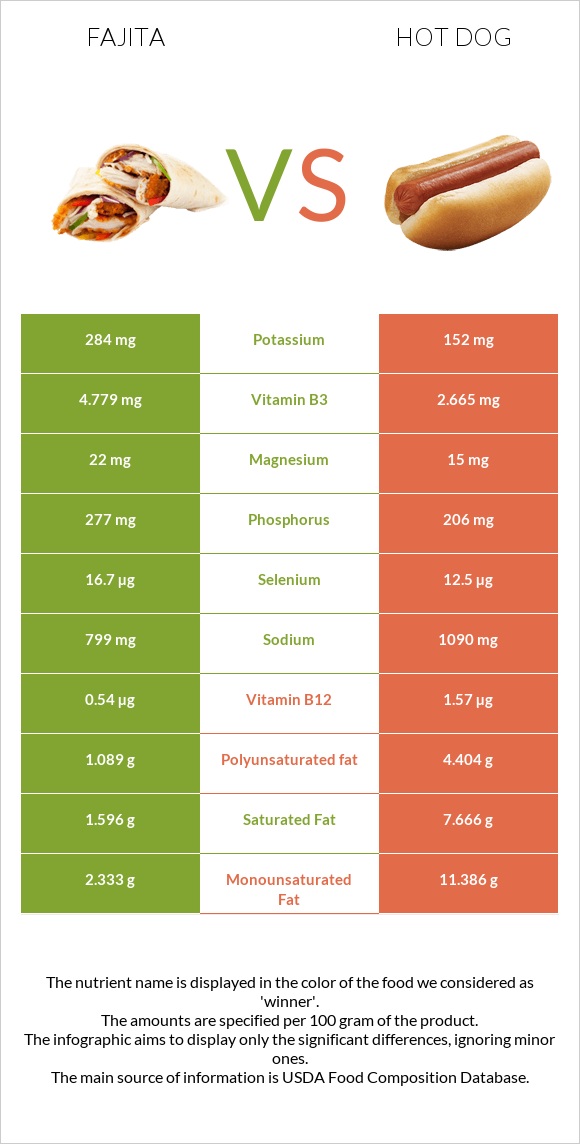
Summary of differences between fajita and hot dogs Fajita has more vitamin B6, vitamin B3, phosphorus, vitamin B5, and selenium, while hot dogs have more vitamin B12, calcium, and copper. Hot dogs cover your daily need for vitamin B12, 43% more than fajita. Fajita contains 2 times more vitamin B5 than hot dogs. While fajita contains 0.726mg of vitamin B5, hot dogs contain only 0.31mg. The amount of sodium in fajita is lower. Hot dogs have a lower glycemic index. The glycemic index of hot dogs is 28, while the glycemic index of fajita is 42. These are the specific foods used in this comparison USDA Commodity, chicken fajita strips, frozen and Frankfurter, meat .
Infographic
Mineral Comparison
Mineral comparison score is based on the number of minerals by which one or the other food is richer. The "coverage" charts below show how much of the daily needs can be covered by 300 grams of the food.
7
100 g
300 g
1 strip - 9.4g
Magnesium
Magnesium
Calcium
Calcium
Potassium
Potassium
Iron
Iron
Copper
Copper
Zinc
Zinc
Phosphorus
Phosphorus
Sodium
Sodium
Manganese
Manganese
Selenium
Selenium
16%
3.9%
25%
37%
10%
37%
119%
104%
8.6%
91%
3
100 g
300 g
1 serving (1 hot dog) - 52g
Magnesium
Magnesium
Calcium
Calcium
Potassium
Potassium
Iron
Iron
Copper
Copper
Zinc
Zinc
Phosphorus
Phosphorus
Sodium
Sodium
Manganese
Manganese
Selenium
Selenium
11%
30%
13%
41%
32%
33%
88%
142%
5.9%
68%
Vitamin Comparison
Vitamin comparison score is based on the number of vitamins by which one or the other food is richer. The "coverage" charts below show how much of the daily needs can be covered by 300 grams of the food.
7
100 g
300 g
1 strip - 9.4g
Vitamin C
Vit. C
Vitamin D
Vit. D
Vitamin A
Vit. A
Vitamin E
Vit. E
Vitamin B1
Vit. B1
Vitamin B2
Vit. B2
Vitamin B3
Vit. B3
Vitamin B5
Vit. B5
Vitamin B6
Vit. B6
Vitamin B12
Vit. B12
Vitamin K
Vit. K
Folate
Folate
0%
0%
0%
4.4%
25%
49%
90%
44%
89%
68%
0.5%
3%
2
100 g
300 g
1 serving (1 hot dog) - 52g
Vitamin C
Vit. C
Vitamin D
Vit. D
Vitamin A
Vit. A
Vitamin E
Vit. E
Vitamin B1
Vit. B1
Vitamin B2
Vit. B2
Vitamin B3
Vit. B3
Vitamin B5
Vit. B5
Vitamin B6
Vit. B6
Vitamin B12
Vit. B12
Vitamin K
Vit. K
Folate
Folate
0%
0%
0%
3.8%
14%
28%
50%
19%
38%
196%
0%
4.5%
All nutrients comparison - raw data values
Nutrient
DV% diff.
Vitamin B12
0.54µg
1.57µg
43%
Fats
5.73g
25.76g
31%
Saturated fat
1.596g
7.666g
28%
Monounsaturated fat
2.333g
11.386g
23%
Polyunsaturated fat
1.089g
4.404g
22%
Protein
18.56g
10.26g
17%
Vitamin B6
0.387mg
0.166mg
17%
Sodium
799mg
1090mg
13%
Vitamin B3
4.779mg
2.665mg
13%
Choline
67.8mg
12%
Phosphorus
277mg
206mg
10%
Calcium
13mg
99mg
9%
Calories
135kcal
290kcal
8%
Selenium
16.7µg
12.5µg
8%
Vitamin B5
0.726mg
0.31mg
8%
Copper
0.03mg
0.097mg
7%
Vitamin B2
0.213mg
0.121mg
7%
Cholesterol
88mg
77mg
4%
Potassium
284mg
152mg
4%
Vitamin B1
0.1mg
0.055mg
4%
Magnesium
22mg
15mg
2%
Zinc
1.37mg
1.2mg
2%
Carbs
2.23g
4.17g
1%
Iron
0.99mg
1.09mg
1%
Manganese
0.066mg
0.045mg
1%
Folate
4µg
6µg
1%
Protein per 100 calories
14g
3.5g
N/A
Calories per 10 g protein
73kcal
283kcal
N/A
Weight per 100 calories
74g
34g
N/A
Unsaturated / Saturated Fat ratio
2.1
2.1
N/A
Net carbs
2.23g
4.17g
N/A
Vitamin E
0.22mg
0.19mg
0%
Vitamin K
0.2µg
0%
Tryptophan
0.2mg
0.111mg
0%
Threonine
0.452mg
0.474mg
0%
Isoleucine
0.813mg
0.53mg
0%
Leucine
1.56mg
0.907mg
0%
Lysine
1.857mg
0.963mg
0%
Methionine
0.552mg
0.291mg
0%
Phenylalanine
0.763mg
0.445mg
0%
Valine
0.847mg
0.555mg
0%
Histidine
0.68mg
0.331mg
0%
Omega-3 - DPA
0.007g
0g
N/A
Omega-6 - Eicosadienoic acid
0.01g
N/A
Macronutrient Comparison
Macronutrient breakdown side-by-side comparison
2
19%
6%
2%
71%
3%
Protein:
18.56 g
Fats:
5.73 g
Carbs:
2.23 g
Water:
70.6 g
Other:
2.88 g
3
10%
26%
4%
56%
4%
Protein:
10.26 g
Fats:
25.76 g
Carbs:
4.17 g
Water:
56.31 g
Other:
3.5 g
Contains
more
Protein Protein
+80.9%
Contains
more
Water Water
+25.4%
Contains
more
Fats Fats
+349.6%
Contains
more
Carbs Carbs
+87%
Contains
more
Other Other
+21.5%
Fat Type Comparison
Fat type breakdown side-by-side comparison
1
32%
46%
22%
Saturated fat:
Sat. Fat
1.596 g
Monounsaturated fat:
Mono. Fat
2.333 g
Polyunsaturated fat:
Poly. Fat
1.089 g
2
33%
49%
19%
Saturated fat:
Sat. Fat
7.666 g
Monounsaturated fat:
Mono. Fat
11.386 g
Polyunsaturated fat:
Poly. Fat
4.404 g
Contains
less
Sat. Fat Saturated fat
-79.2%
Contains
more
Mono. Fat Monounsaturated fat
+388%
Contains
more
Poly. Fat Polyunsaturated fat
+304.4%