Fettuccine vs. Goat — In-Depth Nutrition Comparison
Compare
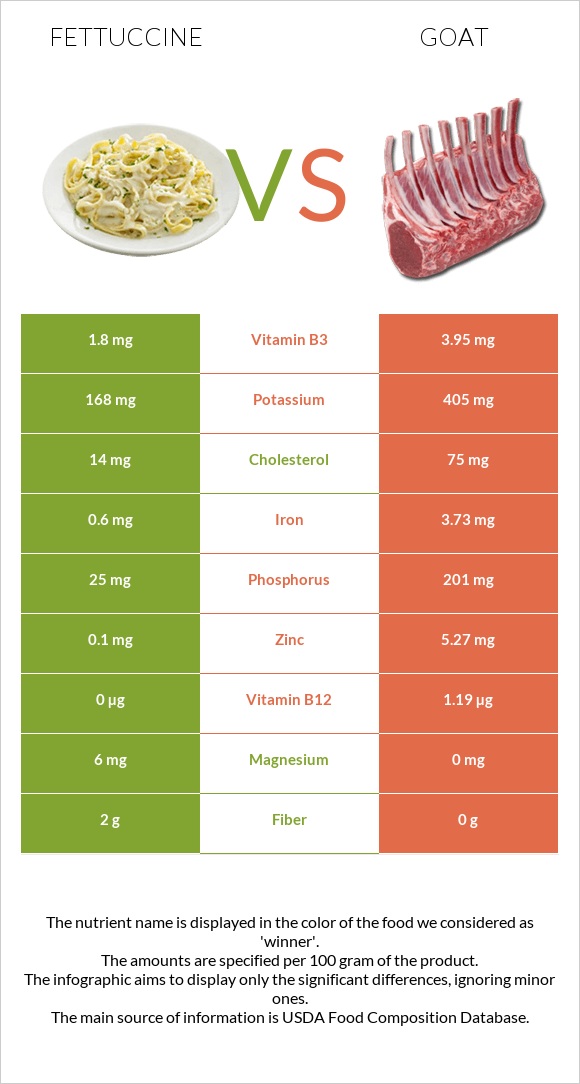
Differences between fettuccine and goat
- Fettuccine has more fiber, while goat has more vitamin B12, zinc, vitamin B2, iron, phosphorus, vitamin B3, and potassium.
- Goat's daily need coverage for vitamin B12 is 50% higher.
- The amount of cholesterol in fettuccine is lower.
- Goat has a lower glycemic index. The glycemic index of goat is 0, while the glycemic index of fettuccine is 47.
The food types used in this comparison are KASHI, STEAM MEAL, Chicken Fettuccine, Frozen Entree and Game meat, goat, cooked, roasted.
Infographic
Infographic link
Mineral Comparison
Mineral comparison score is based on the number of minerals by which one or the other food is richer. The "coverage" charts below show how much of the daily needs can be covered by 300 grams of the food.
| Contains more MagnesiumMagnesium | +∞% |
| Contains more CalciumCalcium | +64.7% |
| Contains more PotassiumPotassium | +141.1% |
| Contains more IronIron | +521.7% |
| Contains more ZincZinc | +5170% |
| Contains more PhosphorusPhosphorus | +704% |
| Contains less SodiumSodium | -48.2% |
Vitamin Comparison
Vitamin comparison score is based on the number of vitamins by which one or the other food is richer. The "coverage" charts below show how much of the daily needs can be covered by 300 grams of the food.
| Contains more Vitamin EVitamin E | +32.4% |
| Contains more Vitamin B6Vitamin B6 | +∞% |
| Contains more FolateFolate | +20% |
| Contains more Vitamin B2Vitamin B2 | +771.4% |
| Contains more Vitamin B3Vitamin B3 | +119.4% |
| Contains more Vitamin B12Vitamin B12 | +∞% |
All nutrients comparison - raw data values
| Nutrient |  |
 |
DV% diff. |
| Vitamin B12 | 0µg | 1.19µg | 50% |
| Zinc | 0.1mg | 5.27mg | 47% |
| Protein | 6.2g | 27.1g | 42% |
| Vitamin B2 | 0.07mg | 0.61mg | 42% |
| Iron | 0.6mg | 3.73mg | 39% |
| Copper | 0.303mg | 34% | |
| Phosphorus | 25mg | 201mg | 25% |
| Selenium | 11.8µg | 21% | |
| Cholesterol | 14mg | 75mg | 20% |
| Choline | 106.4mg | 19% | |
| Vitamin B3 | 1.8mg | 3.95mg | 13% |
| Fiber | 2g | 0g | 8% |
| Potassium | 168mg | 405mg | 7% |
| Carbs | 14g | 0g | 5% |
| Vitamin B6 | 0.05mg | 0mg | 4% |
| Sodium | 166mg | 86mg | 3% |
| Calories | 99kcal | 143kcal | 2% |
| Manganese | 0.042mg | 2% | |
| Fats | 2.7g | 3.03g | 1% |
| Magnesium | 6mg | 0mg | 1% |
| Calcium | 28mg | 17mg | 1% |
| Vitamin E | 0.45mg | 0.34mg | 1% |
| Vitamin K | 1.2µg | 1% | |
| Monounsaturated fat | 0.9g | 1.36g | 1% |
| Polyunsaturated fat | 0.4g | 0.23g | 1% |
| Net carbs | 12g | 0g | N/A |
| Sugar | 1.3g | 0g | N/A |
| Vitamin B1 | 0.09mg | 0.09mg | 0% |
| Folate | 6µg | 5µg | 0% |
| Saturated fat | 0.9g | 0.93g | 0% |
| Tryptophan | 0.403mg | 0% | |
| Threonine | 1.29mg | 0% | |
| Isoleucine | 1.371mg | 0% | |
| Leucine | 2.258mg | 0% | |
| Lysine | 2.016mg | 0% | |
| Methionine | 0.726mg | 0% | |
| Phenylalanine | 0.941mg | 0% | |
| Valine | 1.452mg | 0% | |
| Histidine | 0.565mg | 0% |
Macronutrient Comparison
Macronutrient breakdown side-by-side comparison
Protein:
6.2 g
Fats:
2.7 g
Carbs:
14 g
Water:
75.2 g
Other:
1.9 g
Protein:
27.1 g
Fats:
3.03 g
Carbs:
0 g
Water:
68.21 g
Other:
1.66 g
| Contains more CarbsCarbs | +∞% |
| Contains more OtherOther | +14.5% |
| Contains more ProteinProtein | +337.1% |
| Contains more FatsFats | +12.2% |
~equal in
Water
~68.21g
Fat Type Comparison
Fat type breakdown side-by-side comparison
Saturated fat:
Sat. Fat
0.9 g
Monounsaturated fat:
Mono. Fat
0.9 g
Polyunsaturated fat:
Poly. Fat
0.4 g
Saturated fat:
Sat. Fat
0.93 g
Monounsaturated fat:
Mono. Fat
1.36 g
Polyunsaturated fat:
Poly. Fat
0.23 g
| Contains more Poly. FatPolyunsaturated fat | +73.9% |
| Contains more Mono. FatMonounsaturated fat | +51.1% |
~equal in
Saturated fat
~0.93g


