How are fig bars and bagel different? Bagel is higher than fig bars in manganese, selenium, vitamin B1, phosphorus, folate, vitamin B3, zinc, magnesium, and vitamin B6. Bagel covers your daily need for manganese, 47% more than fig bars. Cookies, fig bars and Bagels, wheat types were used in this article.
Infographic
Mineral Comparison
Mineral comparison score is based on the number of minerals by which one or the other food is richer. The "coverage" charts below show how much of the daily needs can be covered by 300 grams of the food.
3
100 g
300 g
1 cookie - 16g 1 oz - 28.35g 1 Figaroo (2 square halves) - 43g 1 individual package (2 oz package containing 2 3" bars) - 57g
Magnesium
Magnesium
Calcium
Calcium
Potassium
Potassium
Iron
Iron
Copper
Copper
Zinc
Zinc
Phosphorus
Phosphorus
Sodium
Sodium
Manganese
Manganese
Selenium
Selenium
19%
19%
18%
109%
49%
11%
27%
46%
45%
18%
6
100 g
300 g
1 bagel - 98g
Magnesium
Magnesium
Calcium
Calcium
Potassium
Potassium
Iron
Iron
Copper
Copper
Zinc
Zinc
Phosphorus
Phosphorus
Sodium
Sodium
Manganese
Manganese
Selenium
Selenium
36%
6%
15%
104%
58%
30%
61%
57%
187%
157%
Vitamin Comparison
Vitamin comparison score is based on the number of vitamins by which one or the other food is richer. The "coverage" charts below show how much of the daily needs can be covered by 300 grams of the food.
5
100 g
300 g
1 cookie - 16g 1 oz - 28.35g 1 Figaroo (2 square halves) - 43g 1 individual package (2 oz package containing 2 3" bars) - 57g
Vitamin C
Vit. C
Vitamin D
Vit. D
Vitamin A
Vit. A
Vitamin E
Vit. E
Vitamin B1
Vit. B1
Vitamin B2
Vit. B2
Vitamin B3
Vit. B3
Vitamin B5
Vit. B5
Vitamin B6
Vit. B6
Vitamin B12
Vit. B12
Vitamin K
Vit. K
Folate
Folate
1%
0%
3%
13%
40%
50%
35%
22%
17%
11%
15%
26%
4
100 g
300 g
1 bagel - 98g
Vitamin C
Vit. C
Vitamin D
Vit. D
Vitamin A
Vit. A
Vitamin E
Vit. E
Vitamin B1
Vit. B1
Vitamin B2
Vit. B2
Vitamin B3
Vit. B3
Vitamin B5
Vit. B5
Vitamin B6
Vit. B6
Vitamin B12
Vit. B12
Vitamin K
Vit. K
Folate
Folate
0%
0%
0%
6.4%
101%
48%
63%
23%
34%
0%
3.8%
57%
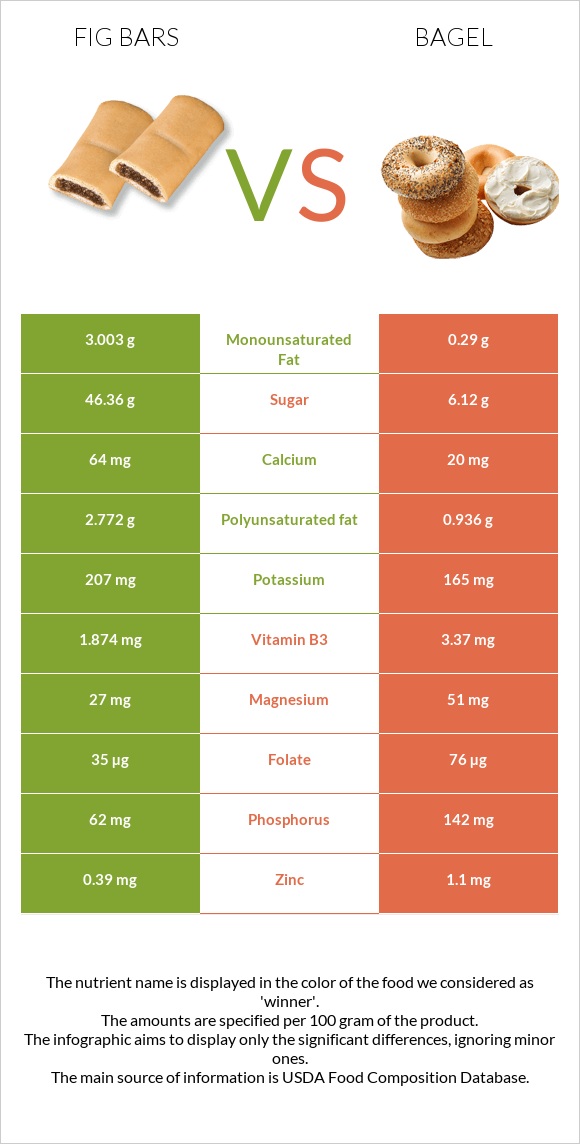
All nutrients comparison - raw data values
Nutrient
DV% diff.
Manganese
0.343mg
1.43mg
47%
Selenium
3.3µg
28.7µg
46%
Vitamin B1
0.158mg
0.403mg
20%
Protein
3.7g
10.2g
13%
Polyunsaturated fat
2.772g
0.936g
12%
Phosphorus
62mg
142mg
11%
Folate
35µg
76µg
10%
Fats
7.3g
1.53g
9%
Vitamin B3
1.874mg
3.37mg
9%
Carbs
70.9g
48.89g
7%
Monounsaturated fat
3.003g
0.29g
7%
Magnesium
27mg
51mg
6%
Zinc
0.39mg
1.1mg
6%
Vitamin B6
0.075mg
0.147mg
6%
Calories
348kcal
250kcal
5%
Saturated fat
1.123g
0g
5%
Calcium
64mg
20mg
4%
Sodium
350mg
439mg
4%
Vitamin B12
0.09µg
0µg
4%
Vitamin K
5.8µg
1.5µg
4%
Copper
0.147mg
0.175mg
3%
Iron
2.9mg
2.76mg
2%
Fiber
4.6g
4.1g
2%
Vitamin E
0.65mg
0.32mg
2%
Potassium
207mg
165mg
1%
Vitamin A
9µg
0µg
1%
Vitamin B2
0.217mg
0.209mg
1%
Choline
14.6mg
9.8mg
1%
Protein per 100 calories
1.1g
4.1g
N/A
Calories per 10 g protein
941kcal
245kcal
N/A
Weight per 100 calories
29g
40g
N/A
Unsaturated / Saturated Fat ratio
5.1
N/A
Vitamin C
0.3mg
0mg
0%
Net carbs
66.3g
44.79g
N/A
Sugar
46.36g
6.12g
N/A
Vitamin B5
0.364mg
0.375mg
0%
Tryptophan
0.046mg
0%
Threonine
0.113mg
0%
Isoleucine
0.132mg
0%
Leucine
0.224mg
0%
Lysine
0.14mg
0%
Methionine
0.053mg
0%
Phenylalanine
0.145mg
0%
Valine
0.155mg
0%
Histidine
0.067mg
0%
Macronutrient Comparison
Macronutrient breakdown side-by-side comparison
2
4%
7%
71%
17%
Protein:
3.7 g
Fats:
7.3 g
Carbs:
70.9 g
Water:
16.5 g
Other:
1.6 g
3
10%
49%
38%
2%
Protein:
10.2 g
Fats:
1.53 g
Carbs:
48.89 g
Water:
37.55 g
Other:
1.83 g
Contains
more
Fats Fats
+377.1%
Contains
more
Carbs Carbs
+45%
Contains
more
Protein Protein
+175.7%
Contains
more
Water Water
+127.6%
Contains
more
Other Other
+14.4%
Fat Type Comparison
Fat type breakdown side-by-side comparison
2
16%
44%
40%
Saturated fat:
Sat. Fat
1.123 g
Monounsaturated fat:
Mono. Fat
3.003 g
Polyunsaturated fat:
Poly. Fat
2.772 g
1
24%
76%
Saturated fat:
Sat. Fat
0 g
Monounsaturated fat:
Mono. Fat
0.29 g
Polyunsaturated fat:
Poly. Fat
0.936 g
Contains
more
Mono. Fat Monounsaturated fat
+935.5%
Contains
more
Poly. Fat Polyunsaturated fat
+196.2%
Contains
less
Sat. Fat Saturated fat
-100%