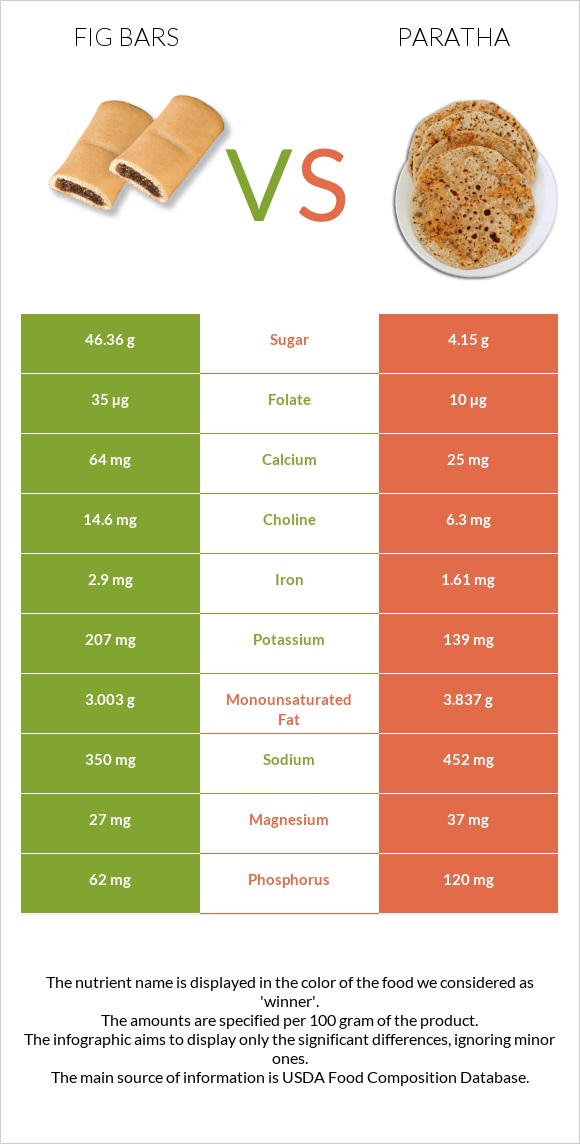
What are the main differences between fig bars and paratha? Fig bars are richer in iron, vitamin B2, and folate, yet paratha is richer in manganese, fiber, phosphorus, and selenium. Paratha's daily need coverage for manganese is 31% higher. Fig bars have 4 times more folate than paratha. Fig bars have 35µg of folate, while paratha has 10µg. Fig bars contain less sodium. Paratha has a lower glycemic index than fig bars. We used Cookies, fig bars and Bread, paratha, whole wheat, commercially prepared, frozen types in this comparison.
Infographic
Mineral Comparison
Mineral comparison score is based on the number of minerals by which one or the other food is richer. The "coverage" charts below show how much of the daily needs can be covered by 300 grams of the food.
4
100 g
300 g
1 cookie - 16g 1 oz - 28.35g 1 Figaroo (2 square halves) - 43g 1 individual package (2 oz package containing 2 3" bars) - 57g
Magnesium
Magnesium
Calcium
Calcium
Potassium
Potassium
Iron
Iron
Copper
Copper
Zinc
Zinc
Phosphorus
Phosphorus
Sodium
Sodium
Manganese
Manganese
Selenium
Selenium
19%
19%
18%
109%
49%
11%
27%
46%
45%
18%
5
100 g
300 g
1 piece - 79g
Magnesium
Magnesium
Calcium
Calcium
Potassium
Potassium
Iron
Iron
Copper
Copper
Zinc
Zinc
Phosphorus
Phosphorus
Sodium
Sodium
Manganese
Manganese
Selenium
Selenium
26%
7.5%
12%
60%
49%
22%
51%
59%
137%
39%
Vitamin Comparison
Vitamin comparison score is based on the number of vitamins by which one or the other food is richer. The "coverage" charts below show how much of the daily needs can be covered by 300 grams of the food.
7
100 g
300 g
1 cookie - 16g 1 oz - 28.35g 1 Figaroo (2 square halves) - 43g 1 individual package (2 oz package containing 2 3" bars) - 57g
Vitamin C
Vit. C
Vitamin D
Vit. D
Vitamin A
Vit. A
Vitamin E
Vit. E
Vitamin B1
Vit. B1
Vitamin B2
Vit. B2
Vitamin B3
Vit. B3
Vitamin B5
Vit. B5
Vitamin B6
Vit. B6
Vitamin B12
Vit. B12
Vitamin K
Vit. K
Folate
Folate
1%
0%
3%
13%
40%
50%
35%
22%
17%
11%
15%
26%
2
100 g
300 g
1 piece - 79g
Vitamin C
Vit. C
Vitamin D
Vit. D
Vitamin A
Vit. A
Vitamin E
Vit. E
Vitamin B1
Vit. B1
Vitamin B2
Vit. B2
Vitamin B3
Vit. B3
Vitamin B5
Vit. B5
Vitamin B6
Vit. B6
Vitamin B12
Vit. B12
Vitamin K
Vit. K
Folate
Folate
0%
0%
0.67%
27%
28%
18%
34%
28%
18%
0%
8.5%
7.5%
All nutrients comparison - raw data values
Nutrient
DV% diff.
Manganese
0.343mg
1.054mg
31%
Saturated fat
1.123g
5.826g
21%
Fiber
4.6g
9.6g
20%
Iron
2.9mg
1.61mg
16%
Starch
31.5g
13%
Vitamin B2
0.217mg
0.076mg
11%
Fats
7.3g
13.2g
9%
Carbs
70.9g
45.35g
9%
Phosphorus
62mg
120mg
8%
Selenium
3.3µg
7.1µg
7%
Folate
35µg
10µg
6%
Protein
3.7g
6.36g
5%
Vitamin E
0.65mg
1.35mg
5%
Calcium
64mg
25mg
4%
Zinc
0.39mg
0.82mg
4%
Sodium
350mg
452mg
4%
Vitamin B1
0.158mg
0.11mg
4%
Vitamin B12
0.09µg
0µg
4%
Magnesium
27mg
37mg
2%
Potassium
207mg
139mg
2%
Vitamin B5
0.364mg
0.465mg
2%
Vitamin K
5.8µg
3.4µg
2%
Choline
14.6mg
6.3mg
2%
Monounsaturated fat
3.003g
3.837g
2%
Polyunsaturated fat
2.772g
2.484g
2%
Calories
348kcal
326kcal
1%
Vitamin A
9µg
2µg
1%
Protein per 100 calories
1.1g
2g
N/A
Calories per 10 g protein
941kcal
513kcal
N/A
Weight per 100 calories
29g
31g
N/A
Unsaturated / Saturated Fat ratio
5.1
1.1
N/A
Vitamin C
0.3mg
0mg
0%
Net carbs
66.3g
35.75g
N/A
Cholesterol
0mg
1mg
0%
Sugar
46.36g
4.15g
N/A
Copper
0.147mg
0.146mg
0%
Vitamin B3
1.874mg
1.83mg
0%
Vitamin B6
0.075mg
0.08mg
0%
Trans fat
0.034g
N/A
Tryptophan
0.046mg
0%
Threonine
0.113mg
0%
Isoleucine
0.132mg
0%
Leucine
0.224mg
0%
Lysine
0.14mg
0%
Methionine
0.053mg
0%
Phenylalanine
0.145mg
0%
Valine
0.155mg
0%
Histidine
0.067mg
0%
Fructose
0.35g
0%
Omega-3 - ALA
0.064g
N/A
Omega-3 - Eicosatrienoic acid
0.003g
N/A
Omega-6 - Gamma-linoleic acid
0.006g
N/A
Omega-6 - Eicosadienoic acid
0.002g
N/A
Omega-6 - Linoleic acid
2.386g
N/A
Macronutrient Comparison
Macronutrient breakdown side-by-side comparison
2
4%
7%
71%
17%
Protein:
3.7 g
Fats:
7.3 g
Carbs:
70.9 g
Water:
16.5 g
Other:
1.6 g
3
6%
13%
45%
34%
Protein:
6.36 g
Fats:
13.2 g
Carbs:
45.35 g
Water:
33.5 g
Other:
1.59 g
Contains
more
Carbs Carbs
+56.3%
Contains
more
Protein Protein
+71.9%
Contains
more
Fats Fats
+80.8%
Contains
more
Water Water
+103%
Fat Type Comparison
Fat type breakdown side-by-side comparison
2
16%
44%
40%
Saturated fat:
Sat. Fat
1.123 g
Monounsaturated fat:
Mono. Fat
3.003 g
Polyunsaturated fat:
Poly. Fat
2.772 g
1
48%
32%
20%
Saturated fat:
Sat. Fat
5.826 g
Monounsaturated fat:
Mono. Fat
3.837 g
Polyunsaturated fat:
Poly. Fat
2.484 g
Contains
less
Sat. Fat Saturated fat
-80.7%
Contains
more
Poly. Fat Polyunsaturated fat
+11.6%
Contains
more
Mono. Fat Monounsaturated fat
+27.8%