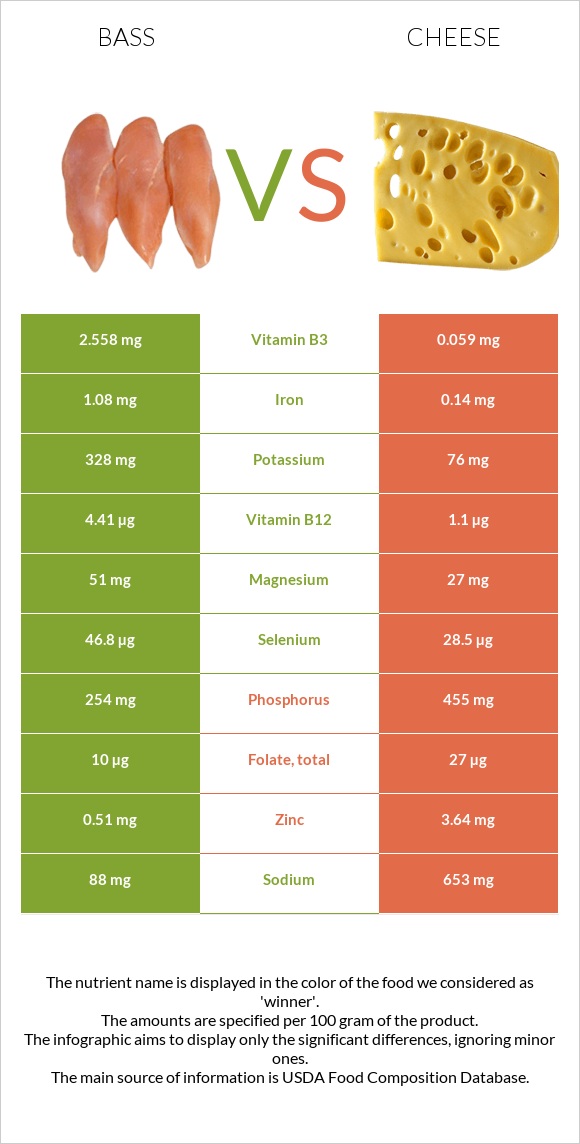
What are the differences between sea bass and cheese? Sea bass is higher in vitamin B12, selenium, and vitamin B6; however, cheese is richer in calcium, vitamin B2, phosphorus, zinc, and vitamin A. Sea bass's daily need coverage for vitamin B12 is 138% more. Cheese contains 5 times less vitamin B6 than sea bass. Sea bass contains 0.346mg of vitamin B6, while cheese contains 0.066mg. Sea bass has less sodium. We used Fish, bass, striped, cooked, dry heat and Cheese, cheddar types in this article.
Infographic
Mineral Comparison
Mineral comparison score is based on the number of minerals by which one or the other food is richer. The "coverage" charts below show how much of the daily needs can be covered by 300 grams of the food.
6
100 g
300 g
3 oz - 85g 1 fillet - 124g
Magnesium
Magnesium
Calcium
Calcium
Potassium
Potassium
Iron
Iron
Copper
Copper
Zinc
Zinc
Phosphorus
Phosphorus
Sodium
Sodium
Manganese
Manganese
Selenium
Selenium
36%
5.7%
29%
41%
13%
14%
109%
11%
2.5%
255%
4
100 g
300 g
1 cubic inch - 17g 1 slice (1 oz) - 28g 1 oz - 28.35g 1 cup, shredded - 113g 1 cup, diced - 132g 1 cup, melted - 244g
Magnesium
Magnesium
Calcium
Calcium
Potassium
Potassium
Iron
Iron
Copper
Copper
Zinc
Zinc
Phosphorus
Phosphorus
Sodium
Sodium
Manganese
Manganese
Selenium
Selenium
19%
213%
6.7%
5.3%
10%
99%
195%
85%
3.5%
155%
Vitamin Comparison
Vitamin comparison score is based on the number of vitamins by which one or the other food is richer. The "coverage" charts below show how much of the daily needs can be covered by 300 grams of the food.
5
100 g
300 g
3 oz - 85g 1 fillet - 124g
Vitamin C
Vit. C
Vitamin D
Vit. D
Vitamin A
Vit. A
Vitamin E
Vit. E
Vitamin B1
Vit. B1
Vitamin B2
Vit. B2
Vitamin B3
Vit. B3
Vitamin B5
Vit. B5
Vitamin B6
Vit. B6
Vitamin B12
Vit. B12
Vitamin K
Vit. K
Folate
Folate
0%
0%
10%
0%
29%
8.5%
48%
52%
80%
551%
0%
7.5%
6
100 g
300 g
1 cubic inch - 17g 1 slice (1 oz) - 28g 1 oz - 28.35g 1 cup, shredded - 113g 1 cup, diced - 132g 1 cup, melted - 244g
Vitamin C
Vit. C
Vitamin D
Vit. D
Vitamin A
Vit. A
Vitamin E
Vit. E
Vitamin B1
Vit. B1
Vitamin B2
Vit. B2
Vitamin B3
Vit. B3
Vitamin B5
Vit. B5
Vitamin B6
Vit. B6
Vitamin B12
Vit. B12
Vitamin K
Vit. K
Folate
Folate
0%
9%
110%
14%
7.3%
99%
1.1%
25%
15%
138%
6%
20%
All nutrients comparison - raw data values
Nutrient
DV% diff.
Vitamin B12
4.41µg
1.1µg
138%
Saturated fat
0.65g
18.867g
83%
Calcium
19mg
710mg
69%
Fats
2.99g
33.31g
47%
Vitamin A
31µg
330µg
33%
Selenium
46.8µg
28.5µg
33%
Vitamin B2
0.037mg
0.428mg
30%
Phosphorus
254mg
455mg
29%
Zinc
0.51mg
3.64mg
28%
Sodium
88mg
653mg
25%
Vitamin B6
0.346mg
0.066mg
22%
Monounsaturated fat
0.846g
9.246g
21%
Vitamin B3
2.558mg
0.059mg
16%
Calories
124kcal
404kcal
14%
Iron
1.08mg
0.14mg
12%
Vitamin B5
0.865mg
0.41mg
9%
Potassium
328mg
76mg
7%
Vitamin B1
0.115mg
0.029mg
7%
Magnesium
51mg
27mg
6%
Vitamin E
0.71mg
5%
Folate
10µg
27µg
4%
Vitamin D*
24 IU
3%
Vitamin D
0.6µg
3%
Choline
16.5mg
3%
Polyunsaturated fat
1.005g
1.421g
3%
Vitamin K
2.4µg
2%
Carbs
0g
3.09g
1%
Cholesterol
103mg
99mg
1%
Copper
0.04mg
0.03mg
1%
Protein
22.73g
22.87g
0%
Protein per 100 calories
18g
5.7g
N/A
Calories per 10 g protein
55kcal
177kcal
N/A
Weight per 100 calories
81g
25g
N/A
Unsaturated / Saturated Fat ratio
2.8
0.57
N/A
Net carbs
0g
3.09g
N/A
Sugar
0.48g
N/A
Manganese
0.019mg
0.027mg
0%
Trans fat
0.917g
N/A
Tryptophan
0.255mg
0.547mg
0%
Threonine
0.997mg
1.044mg
0%
Isoleucine
1.047mg
1.206mg
0%
Leucine
1.848mg
1.939mg
0%
Lysine
2.088mg
1.025mg
0%
Methionine
0.673mg
0.547mg
0%
Phenylalanine
0.887mg
1.074mg
0%
Valine
1.171mg
1.404mg
0%
Histidine
0.669mg
0.547mg
0%
Omega-3 - EPA
0.217g
0.01g
N/A
Omega-3 - DHA
0.75g
0.001g
N/A
Omega-3 - DPA
0.017g
N/A
Omega-6 - Eicosadienoic acid
0.007g
N/A
Macronutrient Comparison
Macronutrient breakdown side-by-side comparison
1
23%
3%
73%
Protein:
22.73 g
Fats:
2.99 g
Carbs:
0 g
Water:
73.36 g
Other:
0.92 g
4
23%
33%
3%
37%
4%
Protein:
22.87 g
Fats:
33.31 g
Carbs:
3.09 g
Water:
37.02 g
Other:
3.71 g
Contains
more
Water Water
+98.2%
Contains
more
Fats Fats
+1014%
Contains
more
Carbs Carbs
+∞%
Contains
more
Other Other
+303.3%
~equal in
Protein
~22.87g
Fat Type Comparison
Fat type breakdown side-by-side comparison
1
26%
34%
40%
Saturated fat:
Sat. Fat
0.65 g
Monounsaturated fat:
Mono. Fat
0.846 g
Polyunsaturated fat:
Poly. Fat
1.005 g
2
64%
31%
5%
Saturated fat:
Sat. Fat
18.867 g
Monounsaturated fat:
Mono. Fat
9.246 g
Polyunsaturated fat:
Poly. Fat
1.421 g
Contains
less
Sat. Fat Saturated fat
-96.6%
Contains
more
Mono. Fat Monounsaturated fat
+992.9%
Contains
more
Poly. Fat Polyunsaturated fat
+41.4%