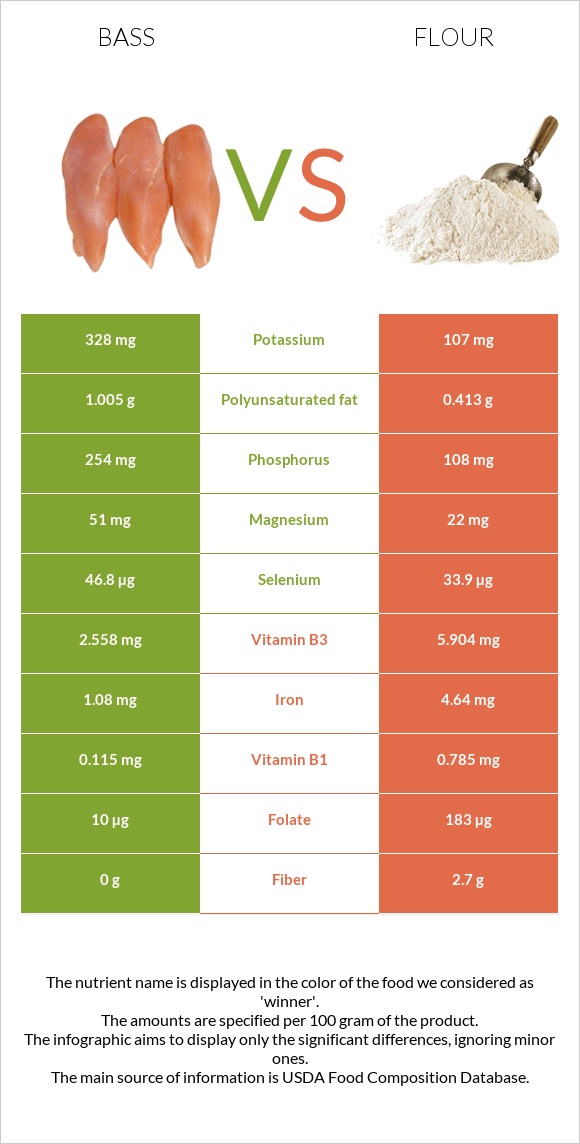
How are sea bass and flour different? Sea bass is higher in vitamin B12, selenium, and vitamin B6; however, flour is richer in vitamin B1, iron, folate, vitamin B2, manganese, and vitamin B3. Daily need coverage for vitamin B12 for sea bass is 184% higher. Sea bass has a lower glycemic index (0) than flour (72). Fish, bass, striped, cooked, dry heat and Wheat flour, white, all-purpose, enriched, bleached are the varieties used in this article.
Infographic
Mineral Comparison
Mineral comparison score is based on the number of minerals by which one or the other food is richer. The "coverage" charts below show how much of the daily needs can be covered by 300 grams of the food.
5
100 g
300 g
3 oz - 85g 1 fillet - 124g
Magnesium
Magnesium
Calcium
Calcium
Potassium
Potassium
Iron
Iron
Copper
Copper
Zinc
Zinc
Phosphorus
Phosphorus
Sodium
Sodium
Manganese
Manganese
Selenium
Selenium
36%
5.7%
29%
41%
13%
14%
109%
11%
2.5%
255%
5
100 g
300 g
1 cup - 125g
Magnesium
Magnesium
Calcium
Calcium
Potassium
Potassium
Iron
Iron
Copper
Copper
Zinc
Zinc
Phosphorus
Phosphorus
Sodium
Sodium
Manganese
Manganese
Selenium
Selenium
16%
4.5%
9.4%
174%
48%
19%
46%
0.26%
89%
185%
Vitamin Comparison
Vitamin comparison score is based on the number of vitamins by which one or the other food is richer. The "coverage" charts below show how much of the daily needs can be covered by 300 grams of the food.
4
100 g
300 g
3 oz - 85g 1 fillet - 124g
Vitamin C
Vit. C
Vitamin D
Vit. D
Vitamin A
Vit. A
Vitamin E
Vit. E
Vitamin B1
Vit. B1
Vitamin B2
Vit. B2
Vitamin B3
Vit. B3
Vitamin B5
Vit. B5
Vitamin B6
Vit. B6
Vitamin B12
Vit. B12
Vitamin K
Vit. K
Folate
Folate
0%
0%
10%
0%
29%
8.5%
48%
52%
80%
551%
0%
7.5%
6
100 g
300 g
1 cup - 125g
Vitamin C
Vit. C
Vitamin D
Vit. D
Vitamin A
Vit. A
Vitamin E
Vit. E
Vitamin B1
Vit. B1
Vitamin B2
Vit. B2
Vitamin B3
Vit. B3
Vitamin B5
Vit. B5
Vitamin B6
Vit. B6
Vitamin B12
Vit. B12
Vitamin K
Vit. K
Folate
Folate
0%
0%
0%
1.2%
196%
114%
111%
26%
10%
0%
0.75%
137%
All nutrients comparison - raw data values
Nutrient
DV% diff.
Vitamin B12
4.41µg
0µg
184%
Vitamin B1
0.115mg
0.785mg
56%
Iron
1.08mg
4.64mg
45%
Folate
10µg
183µg
43%
Vitamin B2
0.037mg
0.494mg
35%
Cholesterol
103mg
0mg
34%
Manganese
0.019mg
0.682mg
29%
Protein
22.73g
10.33g
25%
Carbs
0g
76.31g
25%
Selenium
46.8µg
33.9µg
23%
Vitamin B6
0.346mg
0.044mg
23%
Phosphorus
254mg
108mg
21%
Vitamin B3
2.558mg
5.904mg
21%
Calories
124kcal
364kcal
12%
Copper
0.04mg
0.144mg
12%
Fiber
0g
2.7g
11%
Vitamin B5
0.865mg
0.438mg
9%
Magnesium
51mg
22mg
7%
Potassium
328mg
107mg
7%
Sodium
88mg
2mg
4%
Polyunsaturated fat
1.005g
0.413g
4%
Fats
2.99g
0.98g
3%
Vitamin A
31µg
0µg
3%
Zinc
0.51mg
0.7mg
2%
Choline
10.4mg
2%
Saturated fat
0.65g
0.155g
2%
Monounsaturated fat
0.846g
0.087g
2%
Protein per 100 calories
18g
2.8g
N/A
Calories per 10 g protein
55kcal
352kcal
N/A
Weight per 100 calories
81g
27g
N/A
Unsaturated / Saturated Fat ratio
2.8
3.2
N/A
Net carbs
0g
73.61g
N/A
Calcium
19mg
15mg
0%
Sugar
0.27g
N/A
Vitamin E
0.06mg
0%
Vitamin K
0.3µg
0%
Tryptophan
0.255mg
0.127mg
0%
Threonine
0.997mg
0.281mg
0%
Isoleucine
1.047mg
0.357mg
0%
Leucine
1.848mg
0.71mg
0%
Lysine
2.088mg
0.228mg
0%
Methionine
0.673mg
0.183mg
0%
Phenylalanine
0.887mg
0.52mg
0%
Valine
1.171mg
0.415mg
0%
Histidine
0.669mg
0.23mg
0%
Omega-3 - EPA
0.217g
0g
N/A
Omega-3 - DHA
0.75g
0g
N/A
Macronutrient Comparison
Macronutrient breakdown side-by-side comparison
4
23%
3%
73%
Protein:
22.73 g
Fats:
2.99 g
Carbs:
0 g
Water:
73.36 g
Other:
0.92 g
1
10%
76%
12%
Protein:
10.33 g
Fats:
0.98 g
Carbs:
76.31 g
Water:
11.92 g
Other:
0.46 g
Contains
more
Protein Protein
+120%
Contains
more
Fats Fats
+205.1%
Contains
more
Water Water
+515.4%
Contains
more
Other Other
+100%
Contains
more
Carbs Carbs
+∞%
Fat Type Comparison
Fat type breakdown side-by-side comparison
2
26%
34%
40%
Saturated fat:
Sat. Fat
0.65 g
Monounsaturated fat:
Mono. Fat
0.846 g
Polyunsaturated fat:
Poly. Fat
1.005 g
1
24%
13%
63%
Saturated fat:
Sat. Fat
0.155 g
Monounsaturated fat:
Mono. Fat
0.087 g
Polyunsaturated fat:
Poly. Fat
0.413 g
Contains
more
Mono. Fat Monounsaturated fat
+872.4%
Contains
more
Poly. Fat Polyunsaturated fat
+143.3%
Contains
less
Sat. Fat Saturated fat
-76.2%