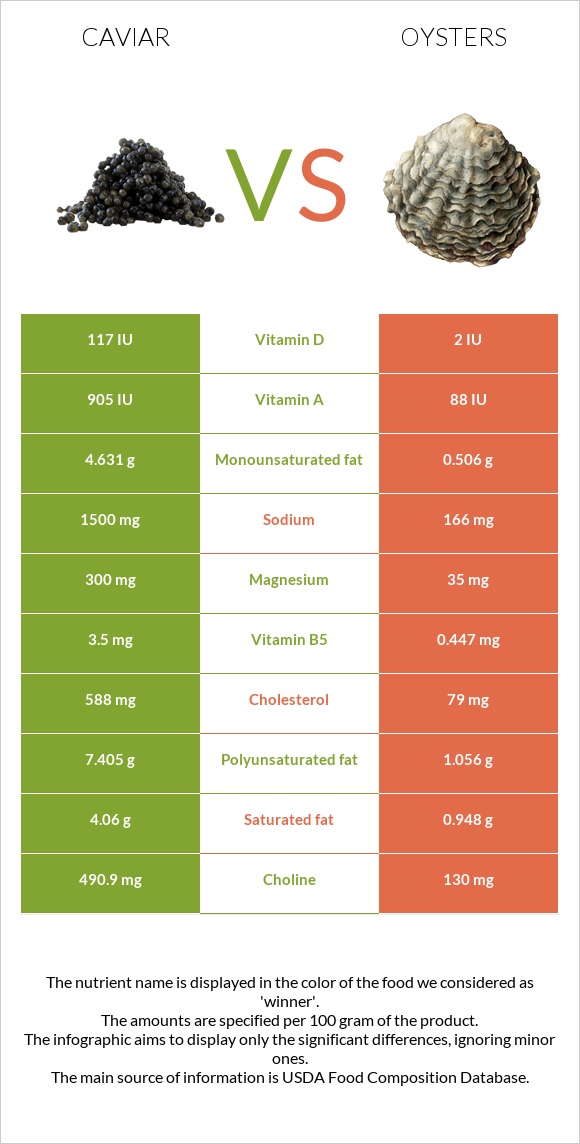
Differences between caviar and oysters Caviar has more vitamin B12, choline, magnesium, vitamin B5, selenium, and vitamin B2, while oysters has more zinc and copper. Oysters's daily need coverage for zinc is 706% higher. Oysters contains 9 times less sodium than caviar. Caviar contains 1500mg of sodium, while oysters contains 166mg. The food types used in this comparison are Fish, caviar, black, and red, granular and Mollusks, oyster, eastern, wild, cooked, moist heat .
Infographic
Mineral Comparison
Mineral comparison score is based on the number of minerals by which one or the other food is richer. The "coverage" charts below show how much of the daily needs can be covered by 300 grams of the food.
6
100 g
300 g
1 tbsp - 16g 1 oz - 28.35g
Magnesium
Magnesium
Calcium
Calcium
Potassium
Potassium
Iron
Iron
Copper
Copper
Zinc
Zinc
Phosphorus
Phosphorus
Sodium
Sodium
Manganese
Manganese
Selenium
Selenium
214%
83%
16%
446%
37%
26%
153%
196%
6.5%
357%
4
100 g
300 g
6 medium - 42g 3 oz - 85g
Magnesium
Magnesium
Calcium
Calcium
Potassium
Potassium
Iron
Iron
Copper
Copper
Zinc
Zinc
Phosphorus
Phosphorus
Sodium
Sodium
Manganese
Manganese
Selenium
Selenium
25%
35%
12%
345%
1902%
2144%
83%
22%
77%
215%
Vitamin Comparison
Vitamin comparison score is based on the number of vitamins by which one or the other food is richer. The "coverage" charts below show how much of the daily needs can be covered by 300 grams of the food.
9
100 g
300 g
1 tbsp - 16g 1 oz - 28.35g
Vitamin C
Vit. C
Vitamin D
Vit. D
Vitamin A
Vit. A
Vitamin E
Vit. E
Vitamin B1
Vit. B1
Vitamin B2
Vit. B2
Vitamin B3
Vit. B3
Vitamin B5
Vit. B5
Vitamin B6
Vit. B6
Vitamin B12
Vit. B12
Vitamin K
Vit. K
Folate
Folate
0%
44%
90%
38%
48%
143%
2.3%
210%
74%
2500%
1.5%
38%
2
100 g
300 g
6 medium - 42g 3 oz - 85g
Vitamin C
Vit. C
Vitamin D
Vit. D
Vitamin A
Vit. A
Vitamin E
Vit. E
Vitamin B1
Vit. B1
Vitamin B2
Vit. B2
Vitamin B3
Vit. B3
Vitamin B5
Vit. B5
Vitamin B6
Vit. B6
Vitamin B12
Vit. B12
Vitamin K
Vit. K
Folate
Folate
0%
0%
8.7%
34%
9%
42%
35%
27%
14%
2188%
5%
11%
All nutrients comparison - raw data values
Nutrient
DV% diff.
Zinc
0.95mg
78.6mg
706%
Copper
0.11mg
5.707mg
622%
Cholesterol
588mg
79mg
170%
Vitamin B12
20µg
17.5µg
104%
Choline
490.9mg
130mg
66%
Magnesium
300mg
35mg
63%
Vitamin B5
3.5mg
0.447mg
61%
Sodium
1500mg
166mg
58%
Selenium
65.5µg
39.5µg
47%
Polyunsaturated fat
7.405g
1.056g
42%
Vitamin B2
0.62mg
0.18mg
34%
Iron
11.88mg
9.21mg
33%
Vitamin A
271µg
26µg
27%
Protein
24.6g
11.42g
26%
Manganese
0.05mg
0.591mg
24%
Phosphorus
356mg
194mg
23%
Fats
17.9g
3.42g
22%
Vitamin B6
0.32mg
0.061mg
20%
Calcium
275mg
116mg
16%
Vitamin D
2.9µg
0µg
15%
Vitamin D*
117 IU
2 IU
14%
Saturated fat
4.06g
0.948g
14%
Vitamin B1
0.19mg
0.036mg
13%
Vitamin B3
0.12mg
1.85mg
11%
Monounsaturated fat
4.631g
0.506g
10%
Folate
50µg
14µg
9%
Calories
264kcal
102kcal
8%
Potassium
181mg
139mg
1%
Vitamin E
1.89mg
1.7mg
1%
Vitamin K
0.6µg
2µg
1%
Protein per 100 calories
9.3g
11g
N/A
Calories per 10 g protein
107kcal
89kcal
N/A
Weight per 100 calories
38g
98g
N/A
Unsaturated / Saturated Fat ratio
3
1.6
N/A
Net carbs
4g
5.45g
N/A
Carbs
4g
5.45g
0%
Sugar
0g
1.23g
N/A
Starch
0.9g
0%
Trans fat
0.068g
N/A
Tryptophan
0.323mg
0.138mg
0%
Threonine
1.263mg
0.046mg
0%
Isoleucine
1.035mg
0.459mg
0%
Leucine
2.133mg
0.716mg
0%
Lysine
1.834mg
0.762mg
0%
Methionine
0.646mg
0.257mg
0%
Phenylalanine
1.071mg
0.413mg
0%
Valine
1.263mg
0.523mg
0%
Histidine
0.649mg
0.22mg
0%
Omega-3 - EPA
2.741g
0.353g
N/A
Omega-3 - DHA
3.8g
0.271g
N/A
Omega-3 - ALA
0.163g
N/A
Omega-3 - DPA
0.229g
0.02g
N/A
Omega-3 - Eicosatrienoic acid
0.004g
N/A
Omega-6 - Gamma-linoleic acid
0.004g
N/A
Omega-6 - Dihomo-gamma-linoleic acid
0.007g
N/A
Omega-6 - Eicosadienoic acid
0.007g
N/A
Omega-6 - Linoleic acid
0.061g
N/A
Macronutrient Comparison
Macronutrient breakdown side-by-side comparison
3
25%
18%
4%
48%
6%
Protein:
24.6 g
Fats:
17.9 g
Carbs:
4 g
Water:
47.5 g
Other:
6 g
2
11%
3%
5%
78%
Protein:
11.42 g
Fats:
3.42 g
Carbs:
5.45 g
Water:
78.19 g
Other:
1.52 g
Contains
more
Protein Protein
+115.4%
Contains
more
Fats Fats
+423.4%
Contains
more
Other Other
+294.7%
Contains
more
Carbs Carbs
+36.3%
Contains
more
Water Water
+64.6%
Fat Type Comparison
Fat type breakdown side-by-side comparison
2
25%
29%
46%
Saturated fat:
Sat. Fat
4.06 g
Monounsaturated fat:
Mono. Fat
4.631 g
Polyunsaturated fat:
Poly. Fat
7.405 g
1
38%
20%
42%
Saturated fat:
Sat. Fat
0.948 g
Monounsaturated fat:
Mono. Fat
0.506 g
Polyunsaturated fat:
Poly. Fat
1.056 g
Contains
more
Mono. Fat Monounsaturated fat
+815.2%
Contains
more
Poly. Fat Polyunsaturated fat
+601.2%
Contains
less
Sat. Fat Saturated fat
-76.7%